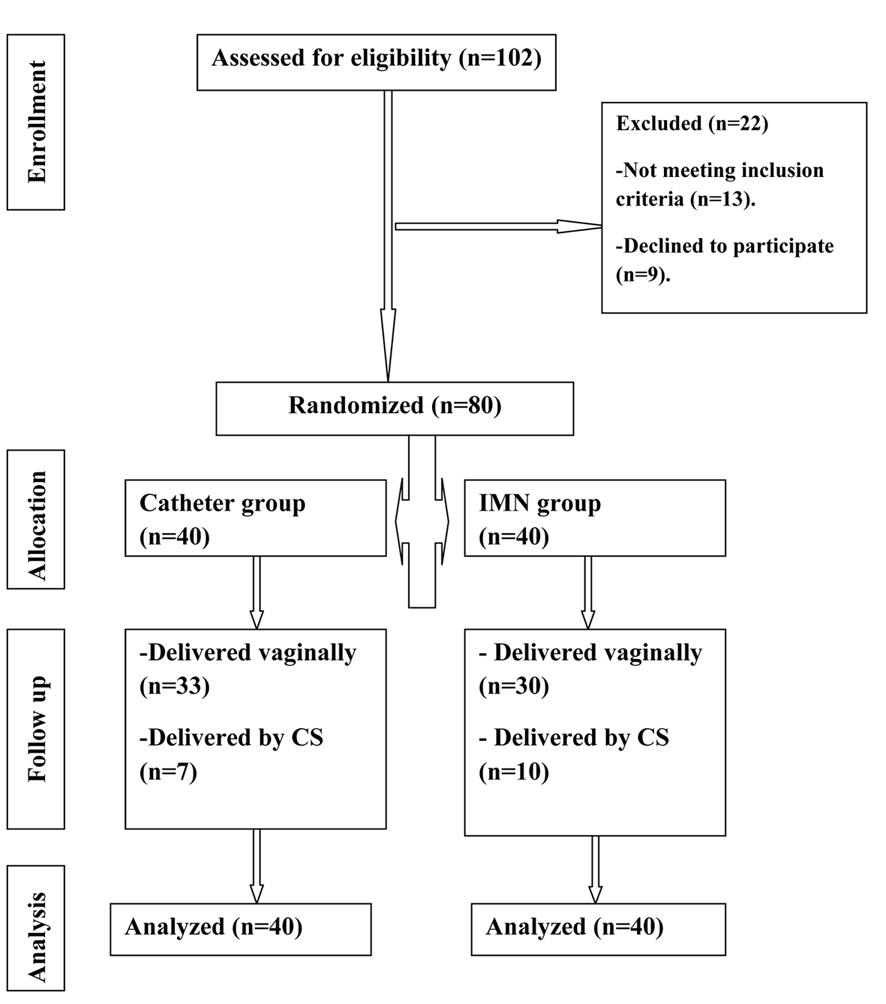
Figure 1. Flow diagram.
| Journal of Clinical Gynecology and Obstetrics, ISSN 1927-1271 print, 1927-128X online, Open Access |
| Article copyright, the authors; Journal compilation copyright, J Clin Gynecol Obstet and Elmer Press Inc |
| Journal website http://www.jcgo.org |
Original Article
Volume 3, Number 2, May 2014, pages 55-61
Intracervical Foley Catheter Versus Vaginal Isosorbid Mononitrate for Induction of Labor in Women With Previous One Cesarean Section
Figure
Tables
| Catheter group (n = 40) | IMN group (n = 40) | t-test | P value | |
|---|---|---|---|---|
| BMI: body mass index. | ||||
| Maternal age (years) | 28.5 ± 3.48 | 28.3 ± 3.56 | 0.254 | > 0.05 |
| Parity | 2.60 ± 0.67 | 2.50 ± 0.75 | 0.495 | > 0.05 |
| Gestational age (weeks) | 40.0 ± 0.78 | 39.75 ± 0.84 | 0.125 | > 0.05 |
| BMI | 29.7 ± 3.2 | 30.4 ± 2.9 | > 0.05 | |
| Catheter group (n = 40) | IMN group (n = 40) | Chi square | P value | |
|---|---|---|---|---|
| *t-test. | ||||
| Initial Bishop score | 3.90 ± 0.84 | 4.0 ± 0.72 | 0.572 | > 0.05* |
| Bishop score after 12 h | 5.95 ± 0.87 P < 0.001 | 6.00 ± 0.72 P < 0.001 | 0.280 | > 0.05* |
| Time from initiation to active phase (h) | 13.35 ± 3.26 | 13.69 ± 2.33 | 0.532 | > 0.05* |
| Duration of the active phase (h) | 8.05 ± 1.59 | 11.31 ± 2.11 | 7.80 | < 0.001* |
| Duration of the second stage (min) | 37.10 ± 13.54 | 52.90 ± 15.63 | 4.83 | < 0.001* |
| Duration of the third stage (min) | 10.90 ± 2.95 | 13.10 ± 2.53 | 3.58 | < 0.01* |
| Augmentation | ||||
| AROM | 20 | 7 | ||
| AROM and oxytocin | 20 | 33 | 9.45 | < 0.05 |
| Induction to delivery interval | 22.2 ± 4.99 | 26.1 ± 3.98 | 0.179 | > 0.05* |
| Delivery within 24 h | 32 | 19 | ||
| Delivery between 24 and 36 h | 8 | 21 | 9.14 | < 0.05 |
| Analgesia | ||||
| None | 28 | 29 | ||
| Opiate | 5 | 4 | ||
| Epidural | 7 | 7 | 0.13 | > 0.05 |
| Failed induction | ||||
| No | 28 | 29 | ||
| Yes | 12 | 11 | 0.061 | > 0.05 |
| Mode of delivery | ||||
| Spontaneous vaginal delivery | 28 | 29 | ||
| Operative vaginal delivery | 5 | 4 | ||
| Caesarean section | 7 | 7 | 0.13 | > 0.05 |
| Catheter group (n = 40) | IMN group (n = 40) | Chi square | P value | |
|---|---|---|---|---|
| A.F.: amniotic fluid; FHR: fetal heart rate; PPH: postpartum hemorrhage. | ||||
| Uterine rupture | 0 | 0 | - | - |
| Hypotension requiring treatment | 2 | 4 | 0.396 | > 0.05 |
| Meconium stained A.F. | 1 | 2 | 0.556 | > 0.05 |
| Abnormal FHR | 2 | 4 | 0.396 | > 0.05 |
| PPH | 7 | 14 | 3.16 | > 0.05 |
| Headache | 3 | 10 | 4.501 | < 0.05 |
| Palpitation | 2 | 5 | 1.41 | > 0.05 |
| Nausea and vomiting | 1 | 3 | 1.05 | > 0.05 |
| Puerperal pyrexia | 12 | 5 | 4.76 | < 0.05 |
| Apgar score at 5 min | ||||
| 4-6 | 12 | 20 | ||
| 7-8 | 16 | 10 | ||
| > 8 | 12 | 10 | 3.57 | > 0.05 |
| Neonatal weight | ||||
| 2.5 - 3 kg | 20 | 24 | ||
| 3.1 - 3.5 kg | 20 | 16 | 0.81 | > 0.05 |
| Admission to NICU | 2 | 5 | 1.41 | > 0.05 |
| Catheter group (n = 40) | IMN group (n = 40) | Chi square | P value | |
|---|---|---|---|---|
| Overall discomfort with induction: | ||||
| Moderate/high/extreme | 6 | 8 | ||
| None or slight | 34 | 32 | 0.346 | > 0.05 |
| Overall satisfaction with induction: | ||||
| Very or somewhat satisfied | 36 | 33 | ||
| Neutral or somewhat not satisfied | 4 | 7 | 0.330 | > 0.05 |
| Would recommend the induction method to other women: | ||||
| Highly or somewhat agree | 35 | 36 | ||
| Neutral or somewhat disagree | 5 | 4 | 0.723 | > 0.05 |