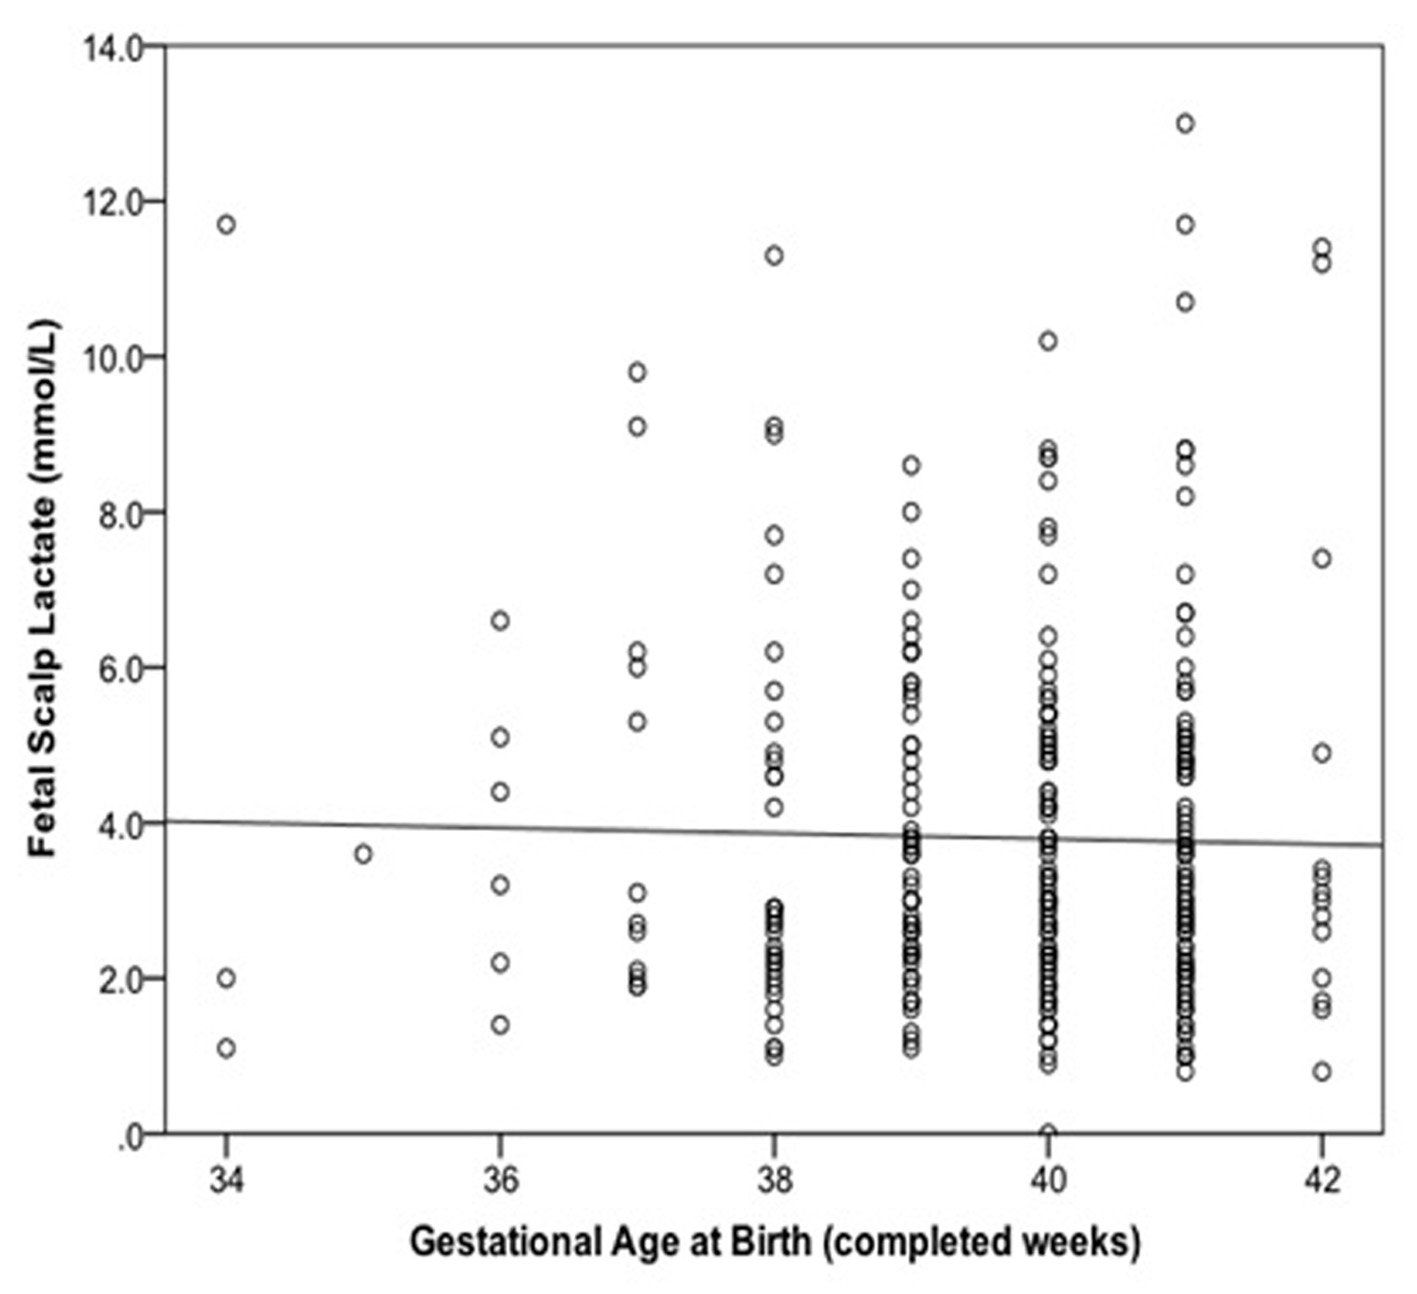
Figure 1. Relationship between fetal scalp lactate and gestational age at birth with linear regression line added.
| Journal of Clinical Gynecology and Obstetrics, ISSN 1927-1271 print, 1927-128X online, Open Access |
| Article copyright, the authors; Journal compilation copyright, J Clin Gynecol Obstet and Elmer Press Inc |
| Journal website http://www.jcgo.org |
Original Article
Volume 4, Number 2, June 2015, pages 212-216
A Study of Various Factors Influencing Fetal Scalp Lactate and Their Correlation With Composite Fetal and Neonatal Outcomes
Figure
Tables
| Characteristics | FSL < 4.8 mmol/L (n = 230) | FSL ≥ 4.8 mmol/L (n = 96) | Significance (P value) |
|---|---|---|---|
| FSL: fetal scalp lactate; IQR: interquartile range. | |||
| Median maternal age (IQR), years | 26 (23 - 31) | 28 (24 - 32) | 0.049 |
| Nulliparous, no. (%) | 177 (77%) | 71 (74%) | 0.56 |
| Median gestational age (IQR), completed weeks | 40 (39 - 31) | 40 (39 - 41) | 0.79 |
| Median time in labor (IQR), h | 8.6 (5.3 - 11.6) | 6.2 (4.0 - 9.9) | 0.001 |
| Median birth weight (IQR), g | 3,435 (3,120 - 3,770) | 3,345 (3,030 - 3,770) | 0.32 |
| Outcomes | FSL < 4.8 mmol/L (n = 230) | FSL ≥ 4.8 mmol/L (n = 96) | Odds ratio (95% CI) | Significance (P value) |
|---|---|---|---|---|
| The combined outcome included the presence of one or more of the following: umbilical artery pH ≤ 7.20, base excess of ≤ -12, Apgar score ≤ 7 at 1 or 5 min, presence of meconium (± operative delivery for fetal distress). FSL: fetal scalp lactate; CI: confidence interval; ODFD: operative delivery for fetal distress. | ||||
| Operative delivery for fetal distress | 84 (36.5%) | 86 (89.6%) | 14.9 (7.37 - 30.3) | < 0.001 |
| Cord pH < 7.2 | 52 (22.6%) | 31 (32.3%) | 1.63 (0.96 - 2.77) | 0.067 |
| Cord base excess ≤ -12 | 6 (2.6%) | 5 (5.2%) | 2.05 (0.61 - 6.89) | 0.311 |
| 1 min Apgar ≤ 7 | 69 (30%) | 47 (49%) | 2.23 (1.37 - 3.65) | 0.001 |
| 5 min Apgar ≤ 7 | 10 (4.3%) | 16 (16.7%) | 4.40 (1.92 - 10.10) | < 0.001 |
| Special care nursery admission | 62 (27.0%) | 33 (34.4%) | 1.42 (0.85 - 2.37) | 0.179 |
| Meconium liquor | 97 (42.2%) | 35 (36.5%) | 0.79 (0.48 - 1.29) | 0.338 |
| Combined outcome (including ODFD) | 184 (80.0%) | 95 (99.0%) | 23.8 (3.23 - 175) | < 0.001 |
| Combined outcome (excluding ODFD) | 163 (70.9%) | 75 (78.1%) | 1.47 (0.84 - 2.57) | 0.18 |
| Independent variable | All factors | Simplified model | ||
|---|---|---|---|---|
| Odds ratio (95% CI) | Significance (P-value) | Odds ratio (95% CI) | Significance (P-value) | |
| CI: confidence interval. | ||||
| Fetal scalp lactate | 1.91 (1.42 - 2.55) | < 0.001 | 1.90 (1.44-2.51) | < 0.001 |
| Maternal age (years) | 1.00 (0.95 - 1.06) | 0.98 | - | - |
| Nulliparous | 1.36 (0.59 - 3.11) | 0.47 | - | - |
| Gestational age | 1.18 (0.92 - 1.52) | 0.20 | - | - |
| Time in labor (h) | 0.95 (0.89 - 1.02) | 0.14 | - | - |
| Birth weight | 1.00 (0.99 - 1.00) | 0.33 | - | - |
| Goodness of fit | ||||
| Nagelkerke R2 | 0.20 | - | 0.17 | - |
| Hosmer and Lemeshow | χ2 = 5.68, df = 8 | 0.68 | χ2 = 5.61, df = 8 | 0.69 |
| Independent variable | All factors† | |
|---|---|---|
| Odds ratio (95% CI) | Significance (P value) | |
| †There were no significant predictors after backward stepwise regression. | ||
| Fetal scalp lactate | 1.10 (0.98 - 1.25) | 0.12 |
| Maternal age (years) | 0.98 (0.94 - 1.03) | 0.95 |
| Nulliparous | 1.52 (0.81 - 2.88) | 0.2 |
| Gestational age | 1.12 (0.92 - 1.36) | 0.28 |
| Time in labor (h) | 0.96 (0.91 - 1.02) | 0.17 |
| Birth weight | 1.00 (0.99 - 1.00) | 0.31 |
| Goodness of fit | ||
| Nagelkerke R2 | 0.039 | - |
| Hosmer and Lemeshow | χ2 = 9.05, df = 8 | 0.34 |