Journal of Clinical Gynecology and Obstetrics, ISSN 1927-1271 print, 1927-128X online, Open Access
Article copyright, the authors; Journal compilation copyright, J Clin Gynecol Obstet and Elmer Press Inc
Journal website http://www.jcgo.org

Original Article

Volume 4, Number 3, September 2015, pages 237-250


Urogenital Biomolecular and Physical Measures in Pre- and Post-Menopausal Women

Figures

Figure 1.
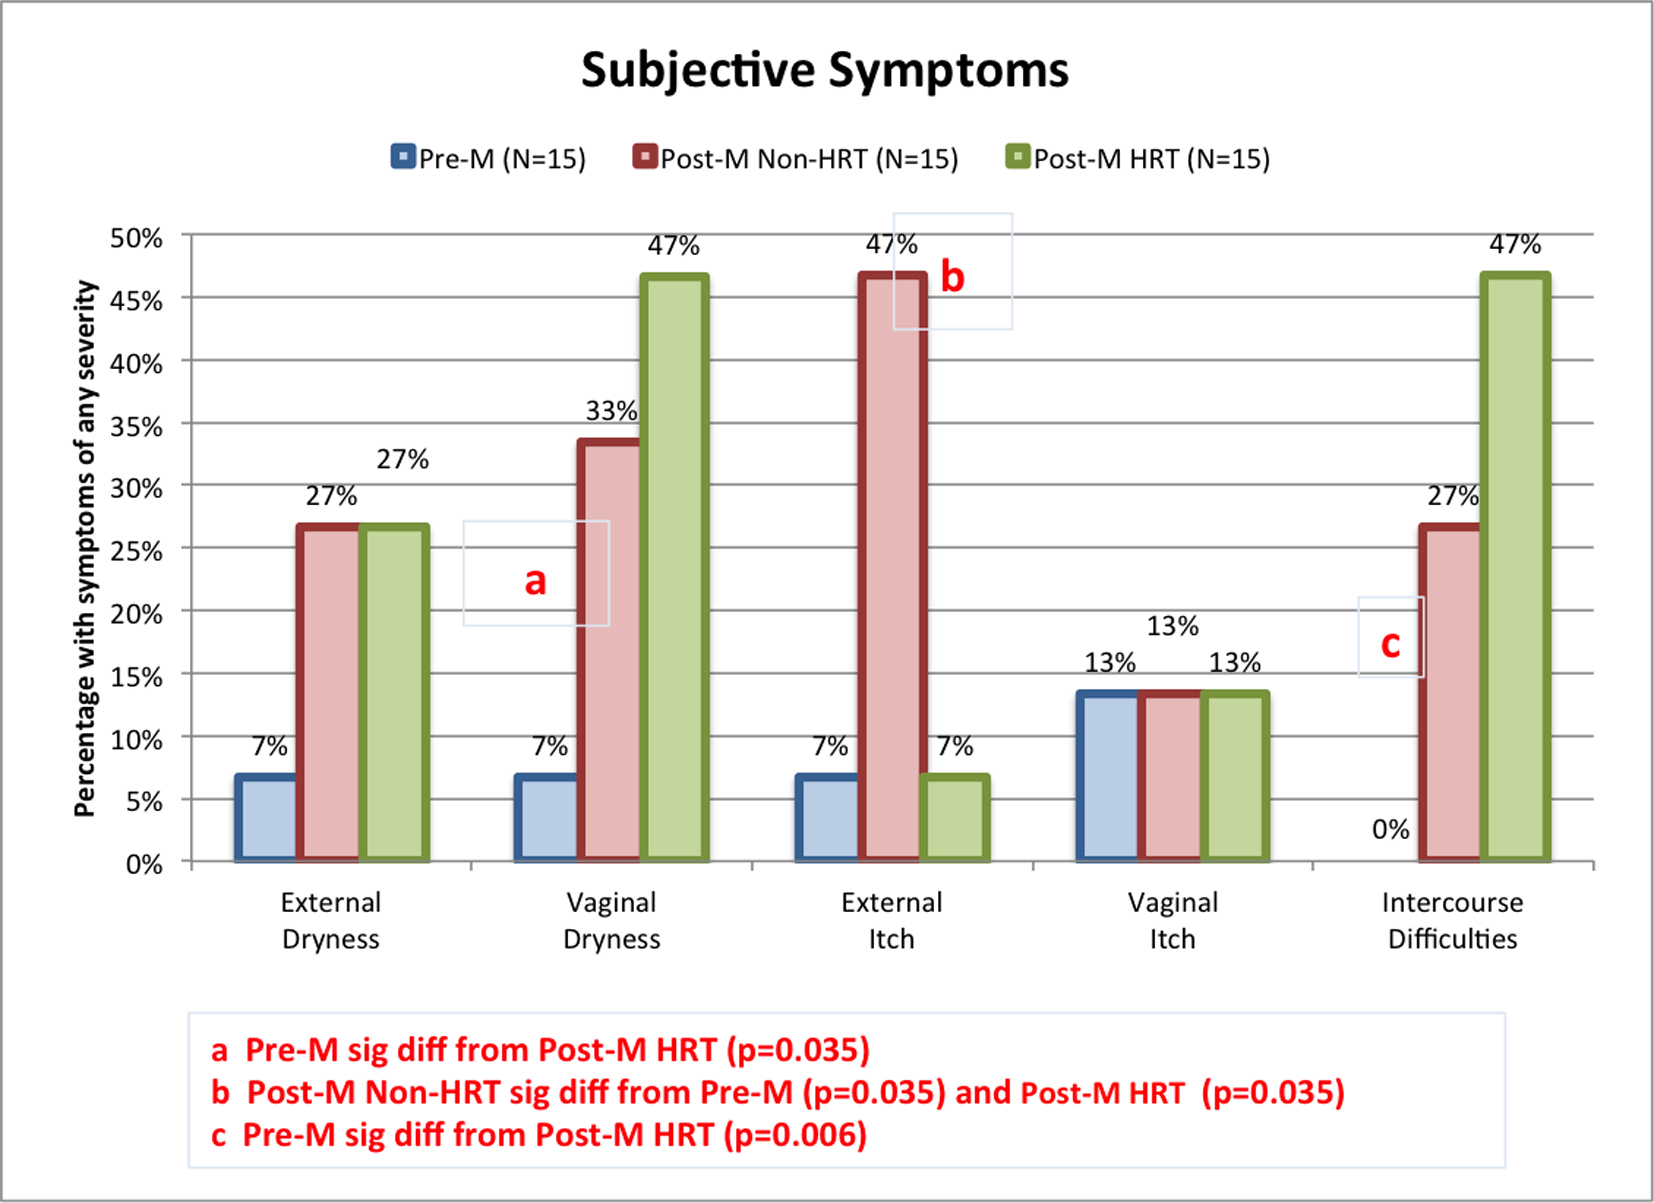
Figure 1. Incidence of subjective urogenital symptoms among test groups. Panelists were asked to rate specific urogenital symptoms, including genital skin dryness and itch, and vaginal dryness and itch on a four-point scale (none, slight, moderate, or considerable). Perceived difficulty having intercourse was rated on the five-point scale (none, slight, moderate, considerable, or unbearable). The proportion of individuals in each test group claiming some degree of symptoms is plotted. Pairwise comparisons were conducted using Fisher’s exact test. Significant differences between groups are indicated on the graph.
Figure 2.
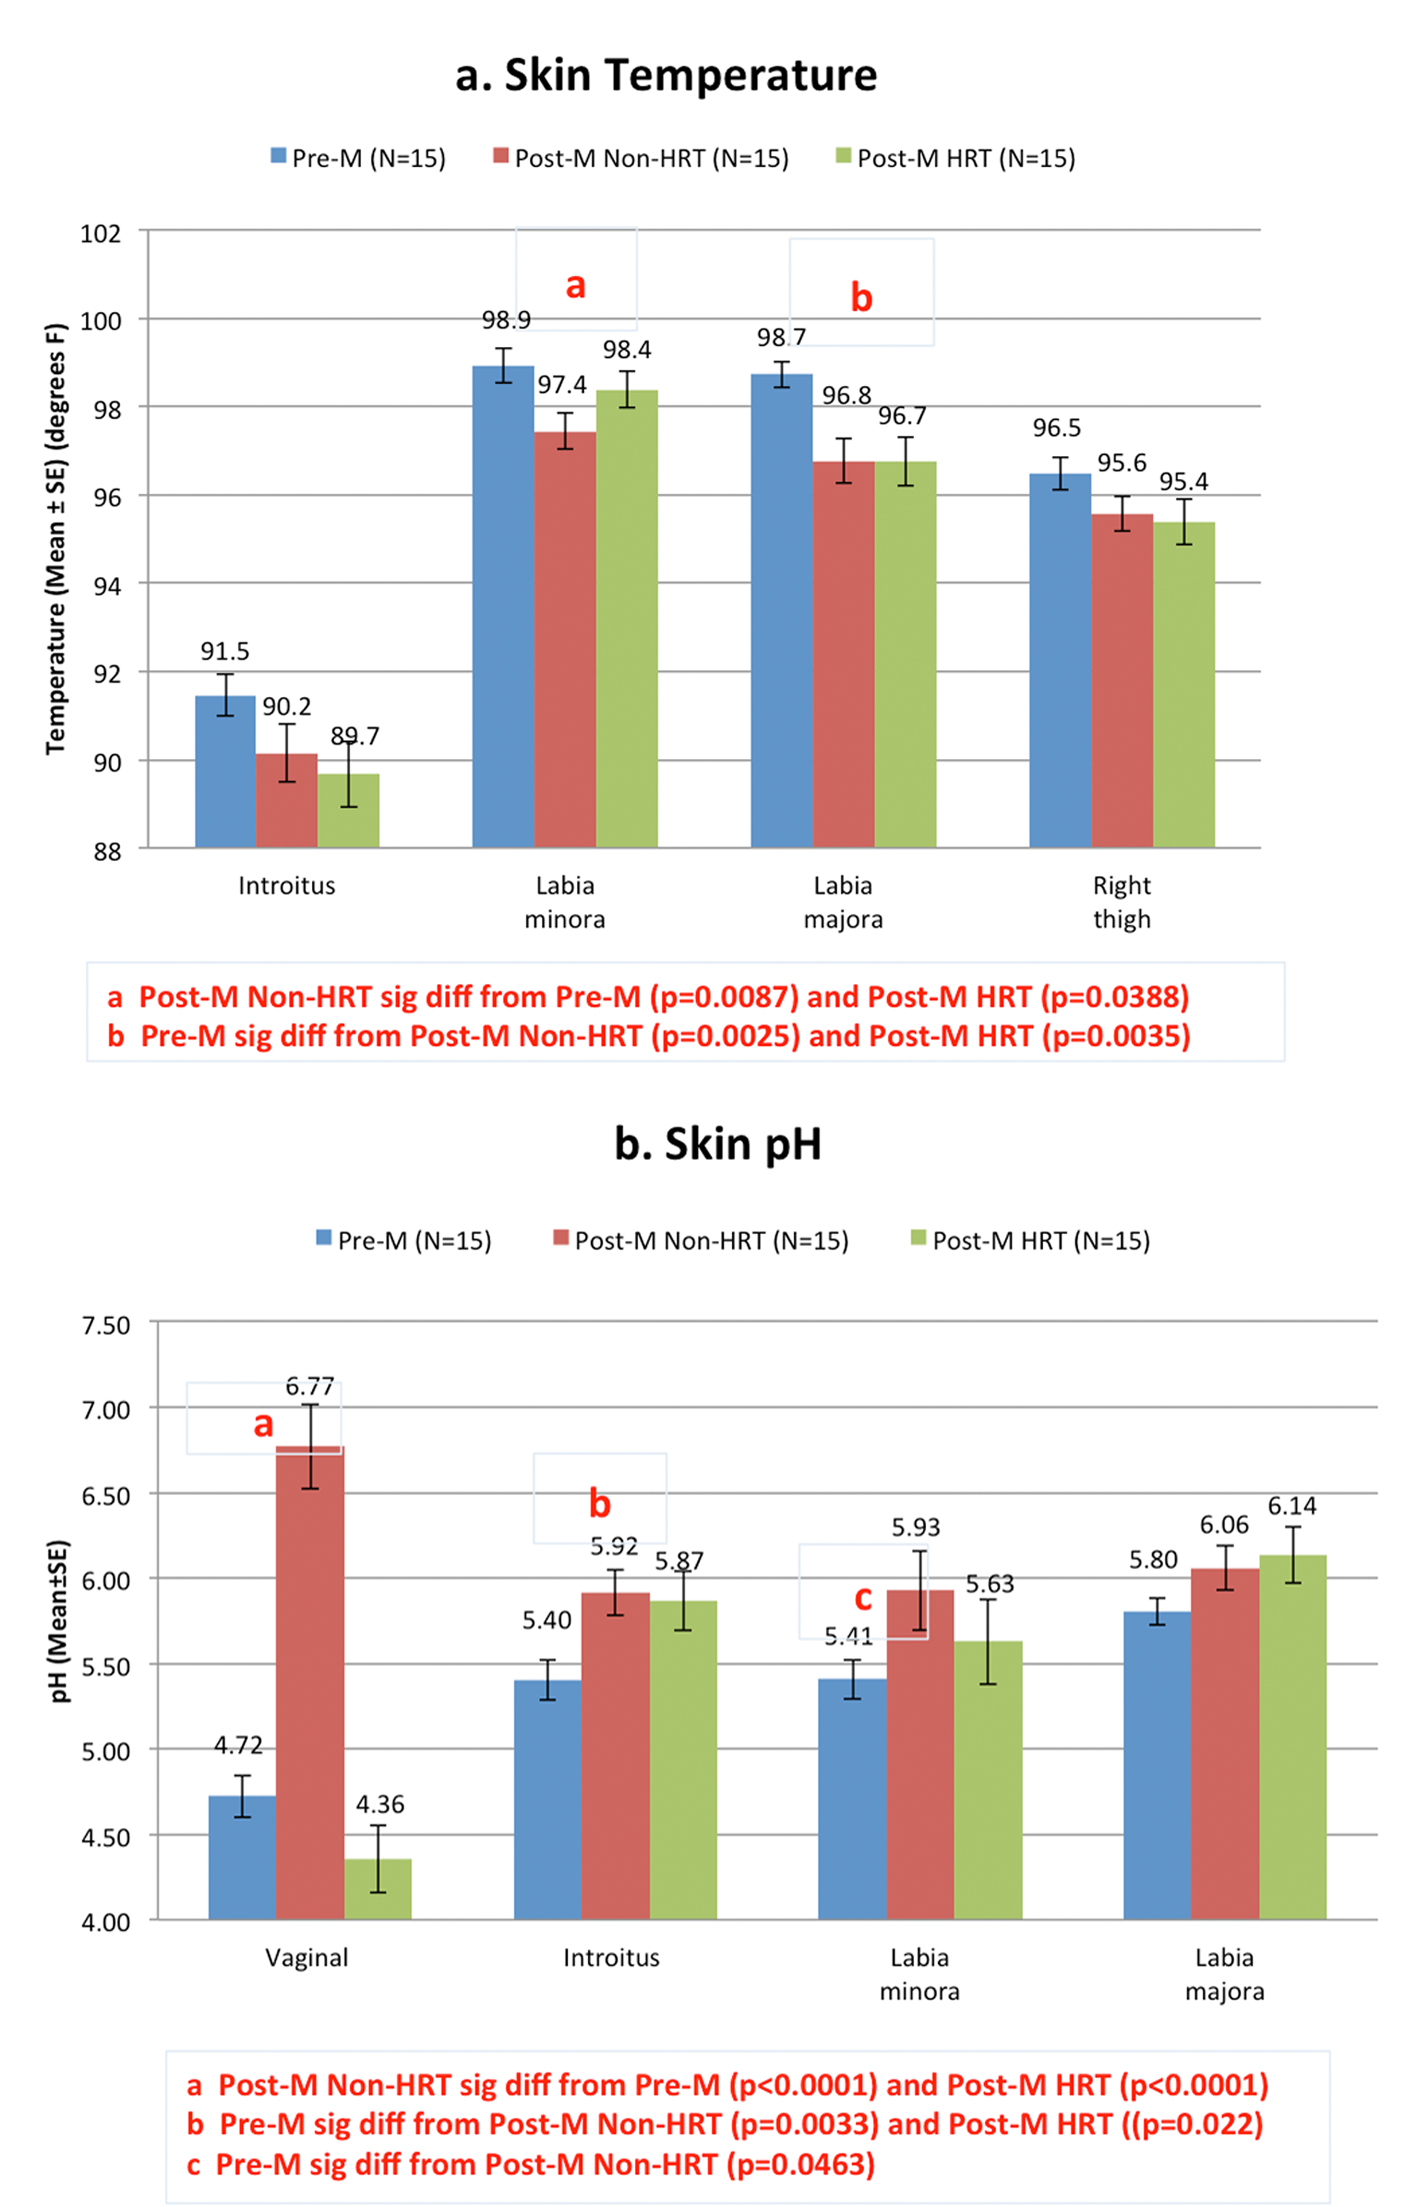
Figure 2. Skin temperature and pH among test groups. Skin temperature (a) and pH (b) were obtained from three different body sites; labia majora, labia minora and introitus. The upper thigh was uses as a control site for the skin temperature measurement. In addition, vaginal pH was measured using litmus paper against the middle to upper third of the lateral wall of the vagina. Pairwise comparisons were conducted using a mixed linear model. Significant differences between groups are indicated on the graph.
Figure 3.
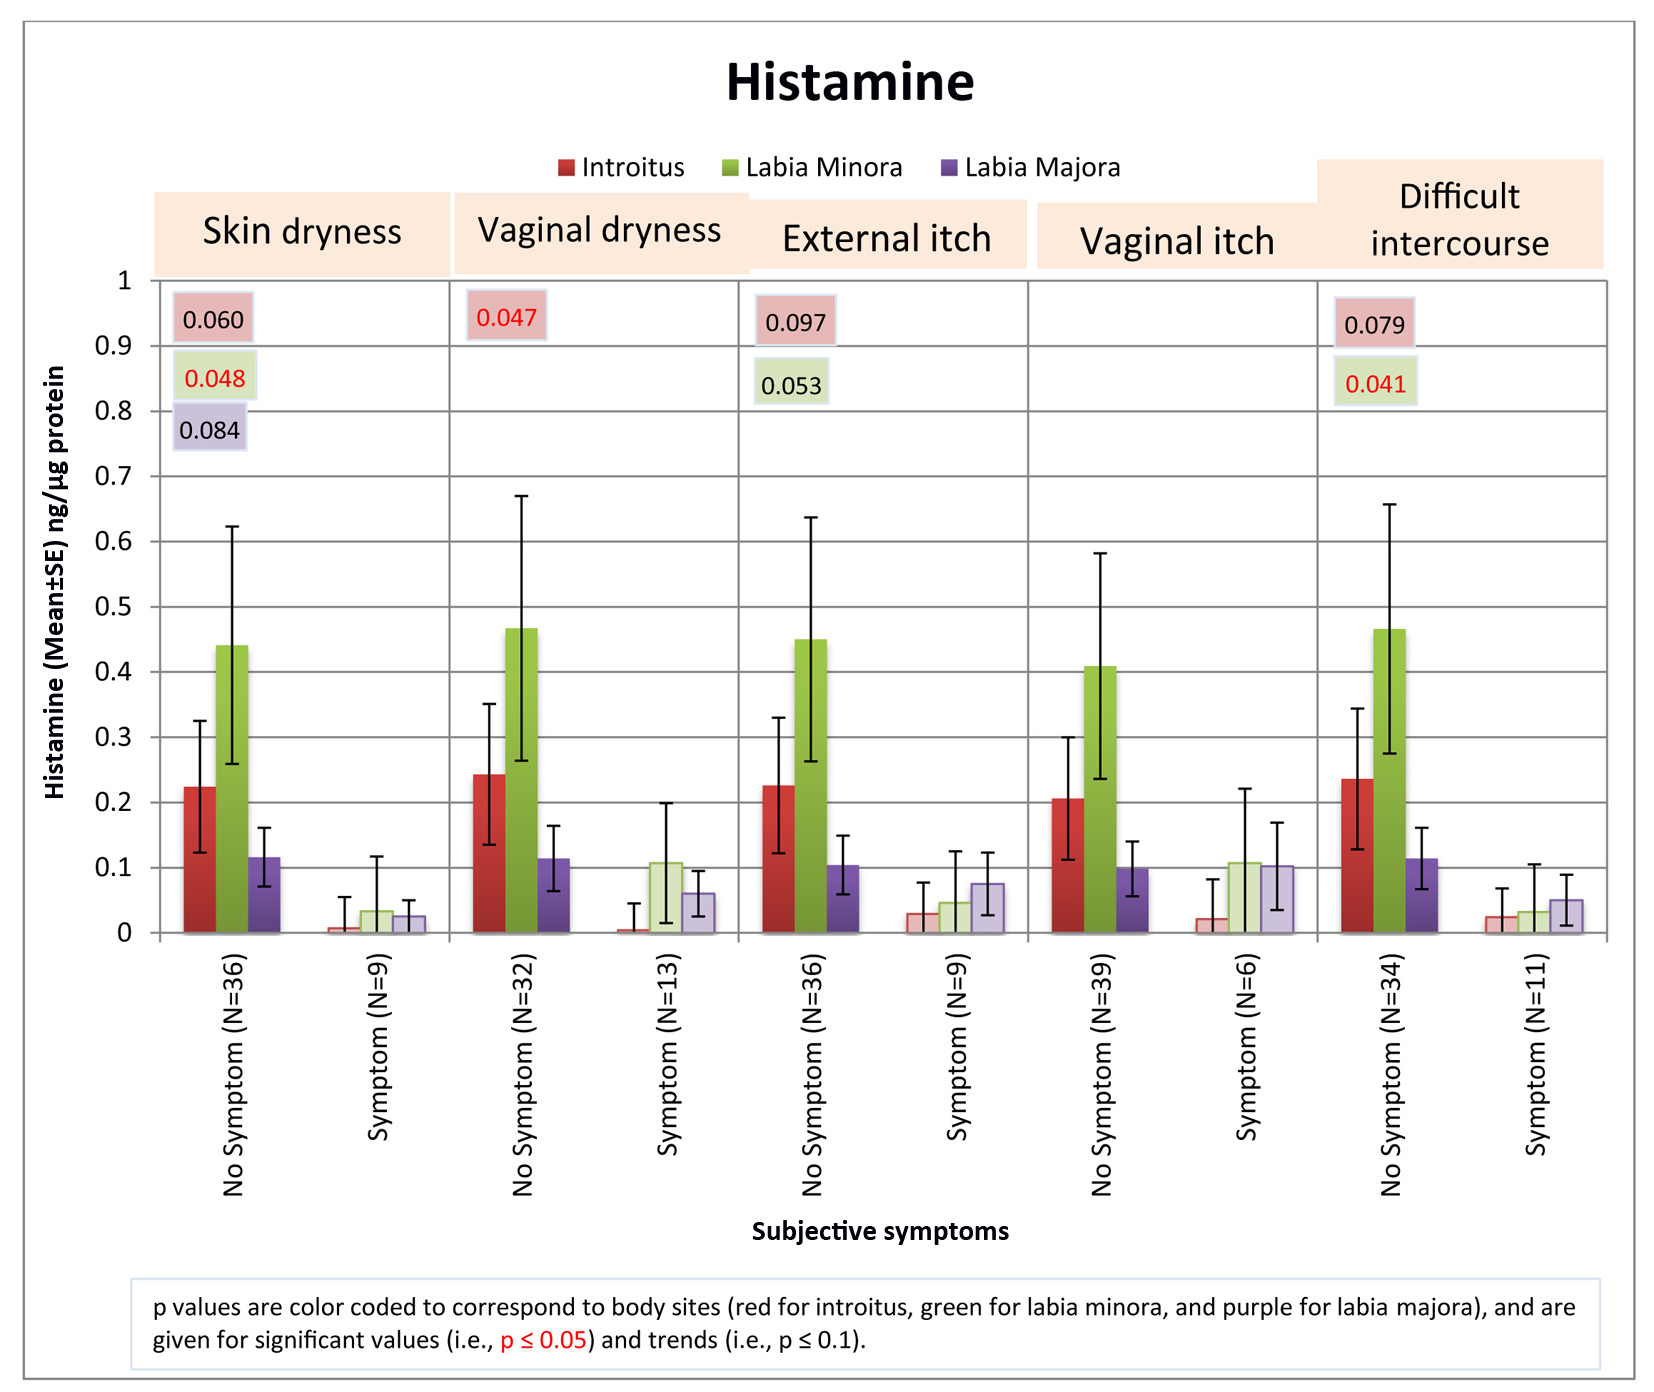
Figure 3. Relationship between histamine levels and subjective symptoms. The levels of histamine detected from individuals who claimed the presence of subjective symptoms was compared to that from individuals who did not claim to experience the symptoms. The entire test population was considered as a whole, regardless of group assignment. Pairwise comparisons were conducted using Fisher’s exact test. Significant differences (P ≤ 0.05) and trends (P ≤ 0.1) between groups are indicated on the graph.
Figure 4.
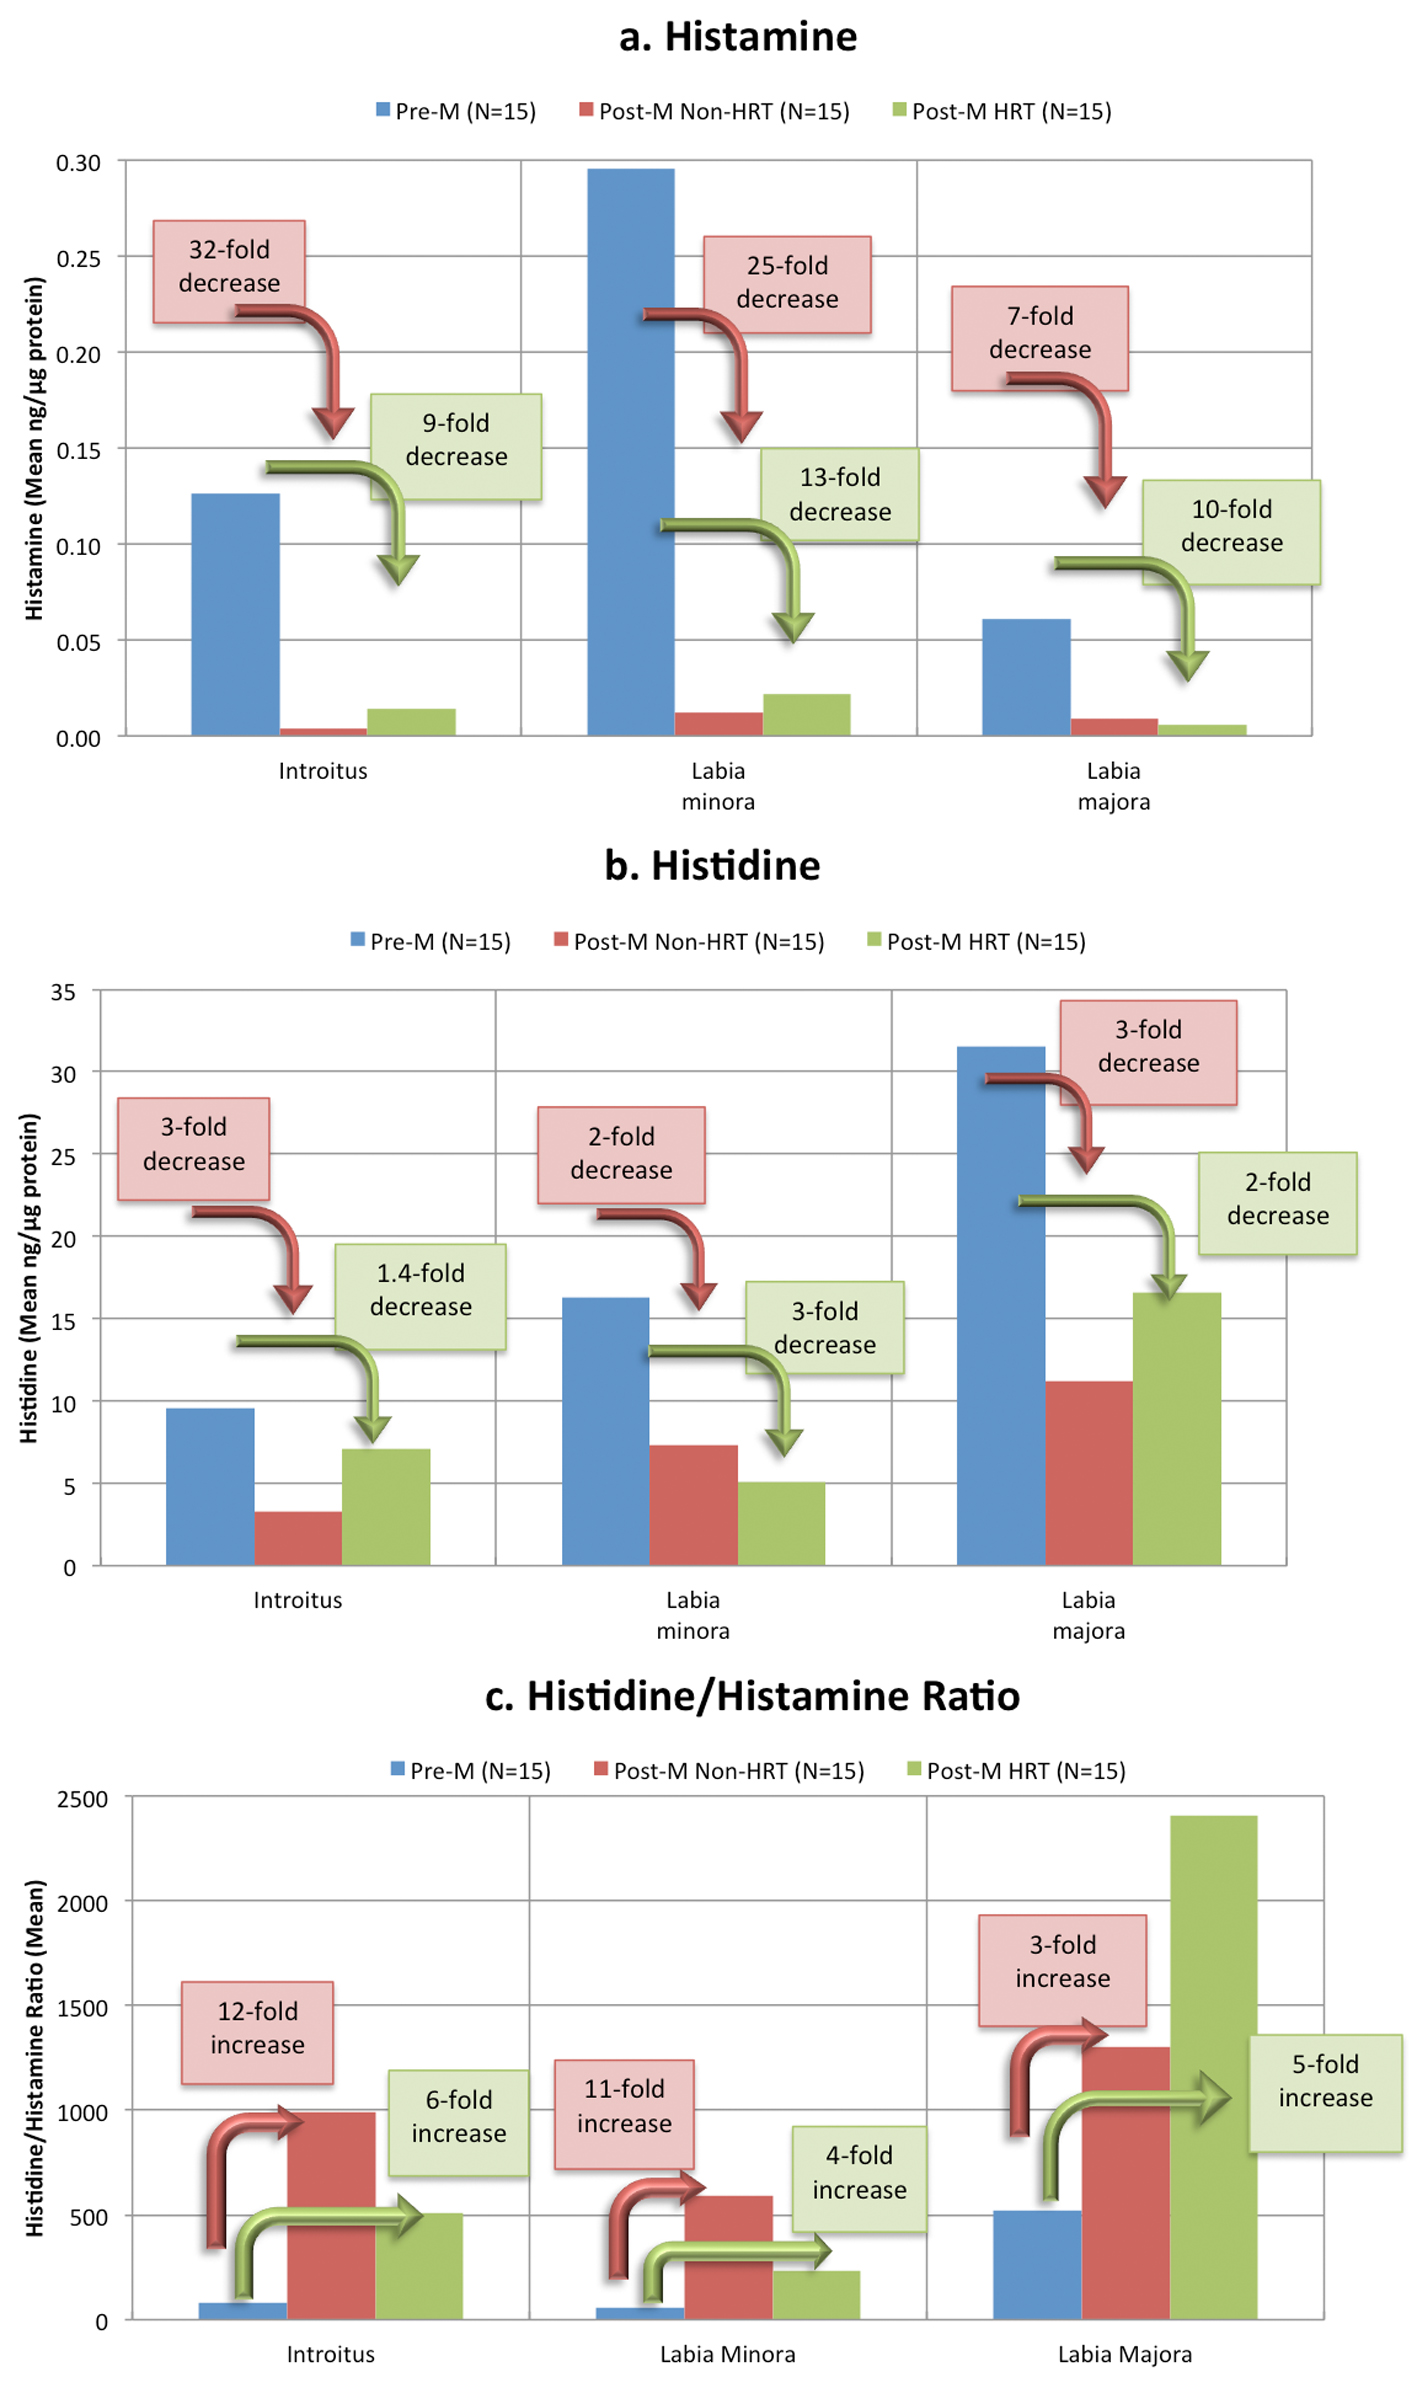
Figure 4. Changes in histamine and histidine at different life stages. The histamine (a), histidine (b) and histidine/histamine ratios (c) at three anatomic sites (given in Table 2) are plotted for each group to illustrate the change from the premenstrual group to the post-menstrual groups. Decrease from pre-M levels for post-M non-HRT group are illustrated by the pink arrows and text boxes, and for Post-M HRT group by the green arrows and text boxes.

Tables

Table 1. Summary of Demographics and Baseline Vaginal Atrophy Scores
 
ParameterPre-menopausal group (pre-M) (N = 15)Post-menopausal, non-HRT group (post-M non-HRT) (N = 15)Post-menopausal with HRT group (post-M HRT) (N = 15)
NA: not applicable. aPost-M HRT group significantly different from pre-M and post-M non-HRT groups (P < 0.0001).
Mean ± SDMean ± SDMean ± SD
Age (years)33.0 ± 6.460.7 ± 3.660.5 ± 3.6
Height (inch)64.7 ± 3.763.5 ± 2.863.9 ± 2.5
Weight (lb)156.0 ± 22.8149.2 ± 27.0147.8 ± 23.7
BMI (%)26.2 ± 3.325.9 ± 3.625.5 ± 4.3
Years since last period (years)NA15.8 ± 9.314.2 ± 8.2
Average time on HRTNANA5 years 2 months
Number (%)Number (%)Number (%)
Ethnicity
  African-American6 (40%)2 (13%)0 (0%)
  Caucasian8 (53%)13 (87%15 (100%)
  Other1 (7%)0 (0%)0 (0%)
Mean ± SEMean ± SEMean ± SE
Vaginal atrophy scores0.29 ± 0.126.98a ± 0.440.71 ± 0.22
Vaginal pH4.72 ± 0.126.77a ± 0.254.36 ± 0.20
MethodNumber (%)Average length of time used
Types of HRT (post-M HRT group only)
Oral7 (46.7%)7 years 6 months
Genital4 (26.7%)3 years 5 months
Patch/dermal2 (13.3%)5 years 10 months
Oral + dermal1 (6.7%)4 years
Oral + dermal + genital1 (6.7%)1 year


Table 2. Measurements of Histamine and Histidine
 
Body sitePre-menopausal group (pre-M)Post-menopausal, non-HRT group (post-M non-HRT)Post-menopausal with HRT group (post-M HRT)Pairwise comparisons (P values)
NAdjusted mean ± SENAdjusted mean ± SENAdjusted mean ± SEPre-M vs. post-M non-HRTPre-M vs. post-M HRTPost-M non-HRT vs. post-M HRT
aAnalyses were adjusted to reflect quantitative value of material of interest per µg total protein.
Histamine (ng/µg)aIntroitus110.126 ± 0.096140.004 ± 0.00370.014 ± 0.0180.00030.0410.16
Labia minora150.295 ± 0.186150.012 ± 0.009120.022 ± 0.0210.00010.0030.43
Labia majora150.061 ± 0.034150.009 ± 0.006150.006 ± 0.0050.0060.0030.65
Histidine (ng/µg)Introitus129.6 ± 4133.3 ± 1.677.1 ± 50.0580.650.19
Labia minora1516.3 ± 4.7147.3 ± 2.6125.1 ± 2.10.0450.0100.36
Labia majora1531.5 ± 8.31511.2 ± 3.51416.6 ± 60.0060.100.25
Histidine/histamineIntroitus1180.6 ± 8813990 ± 1,1817510 ± 1,0040.0300.180.57
Labia minora1555.2 ± 4814591 ± 64612234 ± 3200.0170.180.34
Labia majora15519 ± 312151,303 ± 956142,407 ± 2,0820.200.0530.38


Table 3. Measurements of NMF, Cytokines and Other Biomarkers
 
Body sitePre-menopausal group (pre-M)Post-menopausal, non-HRT group (post-M non-HRT)Post-menopausal with HRT group (post-M HRT)Pairwise comparisons (P values)
NAdjusted mean ± SENAdjusted mean ± SENAdjusted mean ± SEPre-M vs. post-M non-HRTPre-M vs. post-M HRTPost-M non-HRT vs. post-M HRT
aAnalyses were adjusted to reflect quantitative value of material of interest per µg total protein.
NMF and components (2-pyrrolidone-5-acid, proline, trans-urocanic acid, and cis-urocanic acid)
  NMF (ng/µg)aIntroitus1142.5 ± 181423.3 ± 10748.3 ± 320.250.840.18
Labia minora1572.9 ± 181553.5 ± 161228.1 ± 100.370.0160.066
Labia majora15286 ± 5315193 ± 4215179 ± 440.130.0910.75
  2-pyrrolidone-5-acid (ng/µg)Introitus1216.9 ± 6.8149.5 ± 4.2721.6 ± 150.270.700.14
Labia minora1531.7 ± 91522.3 ± 7.51211.8 ± 4.90.350.0240.10
Labia majora15141 ± 271594.4 ± 211589.8 ± 22.90.140.120.84
  Proline (ng/µg)Introitus127.2 ± 1.9145.4 ± 1.578.4 ± 3.50.400.720.23
Labia minora159.2 ± 1.4158.1 ± 1.4124.3 ± 0.90.540.00230.0045
Labia majora1522.5 ± 3.51513.9 ± 2.61511 ± 2.30.0330.00400.28
  Trans-urocanic acid (ng/µg)Introitus125.7 ± 2.9144.1 ± 2.2611 ± 100.590.410.16
Labia minora1510.3 ± 3.41512.8 ± 5115.6 ± 2.80.610.220.069
Labia majora1573.1 ± 151571.4 ± 181555.5 ± 160.940.380.36
  Cis-urocanic acidevaluated, but not detected
Cytokines
  IL-1a (pg/µg)Introitus151.5 ± 0.3152.1 ± 0.5152.7 ± 0.80.310.0790.36
Labia minora151.4 ± 0.3153 ± 0.7151.8 ± 0.50.00910.410.056
Labia majora158.3 ± 1.71514.8 ± 3.61517.8 ± 4.90.0450.0140.48
  IL-1ra (pg/µg)Introitus1560.4 ± 141536.7 ± 9.81550.9 ± 15.30.110.600.27
Labia minora1559.7 ± 161548.7 ± 151577 ± 270.570.500.17
Labia majora158 ± 2.5144.9 ± 1.9132.9 ± 1.30.250.0320.22
  IL-1ra/IL-1aIntroitus1540.2 ± 151517.9 ± 7.71519 ± 9.30.0900.140.89
Labia minora1541.8 ± 151516.3 ± 7.21542.5 ± 210.0530.970.038
Labia majora151 ± 0.5140.3 ± 0.2130.2 ± 0.10.0970.0110.24
  IL-6evaluated, but not detected
  IL-10evaluated, but not detected
Other
  Squame (%Abs, 850 nm)Introitus155.9 ± 0.5153.4 ± 0.3155.1 ± 0.6< 0.00010.270.0021
Labia minora154.4 ± 0.3154.4 ± 0.4152.6 ± 0.30.94< 0.0001< 0.0001
Labia majora156.5 ± 0.3156.8 ± 0.4155.2 ± 0.40.500.00800.0002
  HSA (ng/µg)Introitus81.9 ± 1.391.9 ± 1.351.3 ± 1.40.980.650.64
Labia minora141.2 ± 0.4152.9 ± 1.1110.8 ± 0.40.0440.510.0083
Labia majora151.7 ± 0.4151.6 ± 0.4130.9 ± 0.30.860.0740.070
  Involucrin (ng/µg)Introitus80.4 ± 0.290.8 ± 0.350.6 ± 0.40.150.470.61
Labia minora140.2 ± 0.1150.3 ± 0.1110.3 ± 0.10.250.450.76
Labia majora150.1 ± 0150.1 ± 0130 ± 00.680.230.36
  Keratin110 (ng/µg)Introitus82 ± 0.991.6 ± 0.750.7 ± 0.50.700.110.14
Labia minora141.8 ± 0.3141.1 ± 0.2111.4 ± 0.40.0410.370.28
Labia majora131.2 ± 0.2111.1 ± 0.371.3 ± 0.40.850.690.56
  Protein (cytokine) (µg/mL)Introitus1541.9 ± 6.31539.5 ± 7.11533.1 ± 6.60.780.300.38
Labia minora1531.9 ± 41538.6 ± 5.71534.8 ± 5.80.290.650.54
Labia majora1512.3 ± 1.51512 ± 1.7159.4 ± 1.50.890.150.14
  Protein SkinMap (µg/mL)Introitus847.3 ± 9.8954.8 ± 12563.4 ± 200.590.390.64
Labia minora1446.5 ± 7.81544.3 ± 8.51144.3 ± 110.830.851.00
Labia majora1521.6 ± 3.61515.5 ± 31310 ± 2.30.160.00410.059


Table 4. Number of Tape Strips Tolerated by Subjects
 
Body sitePre-menopausal (pre-M) (N = 15)Post-menopausal non-HRT (post-M non-HRT) (N = 15)Post-menopausal HRT (post-M HRT) (N = 15)Pairwise comparisons (P value)
Adjusted mean ± SEAdjusted mean ± SEAdjusted mean ± SEPre-M vs. post-M non-HRTPre-M vs. post-M HRTPost-M non-HRT vs. post-M HRT
Introitus4.4 ± 0.66.5 ± 0.84.5 ± 0.80.0390.960.034
Labia minora6.5 ± 0.78.1 ± 0.85.1 ± 0.90.110.190.002
Labia majora9.3 ± 0.510.1 ± 0.58.2 ± 0.60.270.130.006