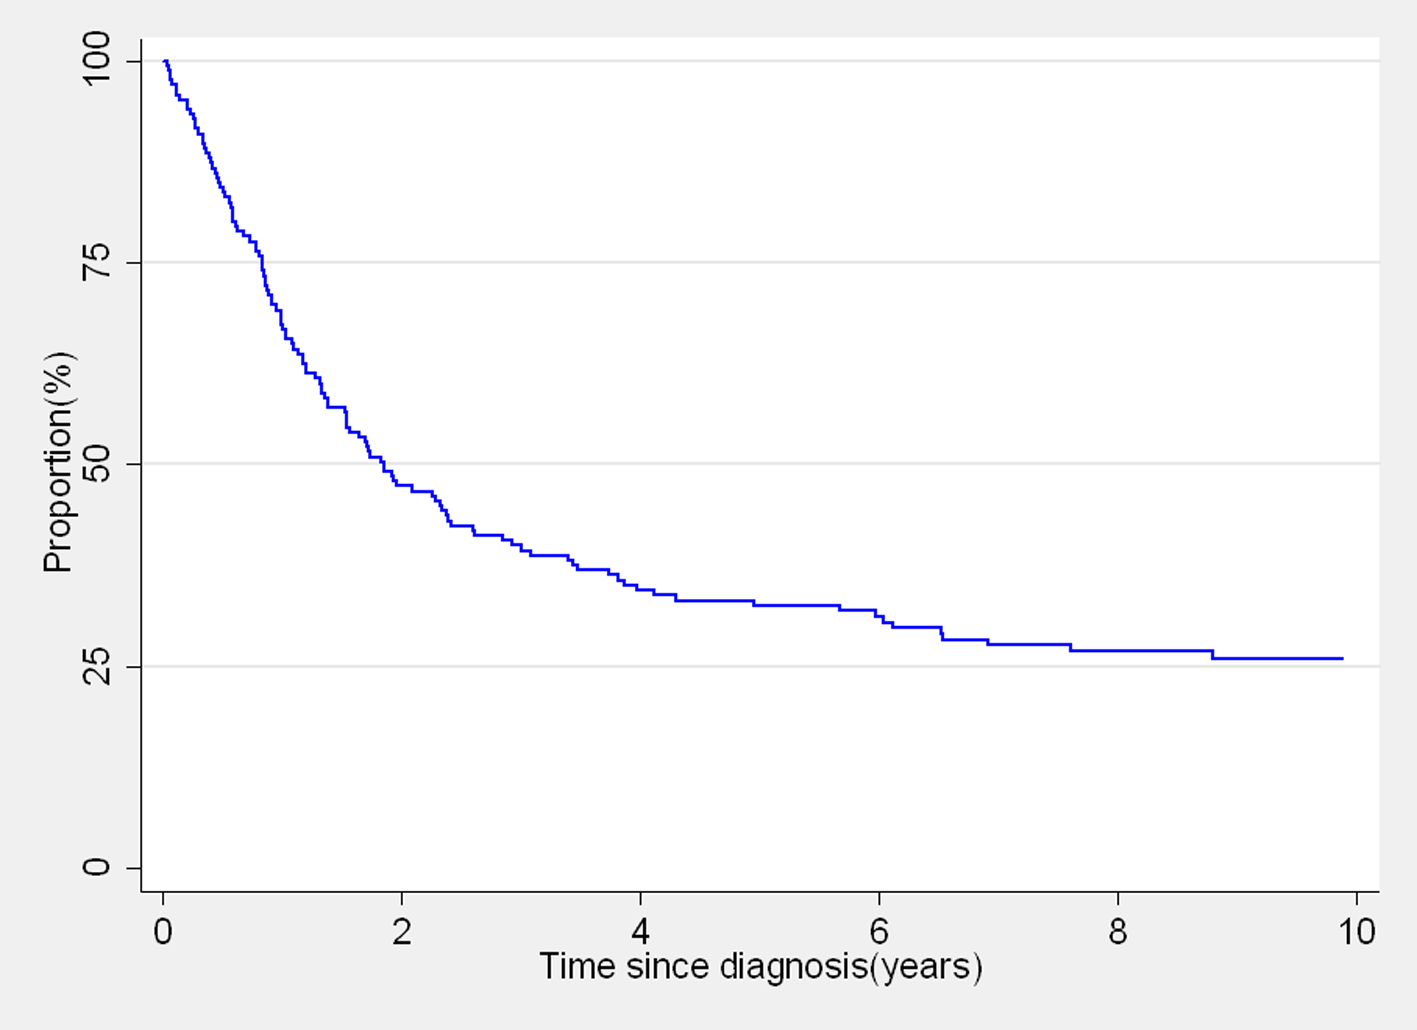
Figure 1. Kaplan-Meier overall survival curve of 165 women diagnosed with cervix cancer from the control arm.
| Journal of Clinical Gynecology and Obstetrics, ISSN 1927-1271 print, 1927-128X online, Open Access |
| Article copyright, the authors; Journal compilation copyright, J Clin Gynecol Obstet and Elmer Press Inc |
| Journal website http://www.jcgo.org |
Original Article
Volume 4, Number 4, December 2015, pages 290-296
Survival of Patients With Cervical Cancer in Rural India
Figures
Tables
| Women’s characteristics | Number of women with cancer n (%) | Observed survival (%) at | P-value | ||
|---|---|---|---|---|---|
| 1-year | 3-year | 5-year | |||
| *The information on education is missing for three observations. INR: Indian Rupees. 50 INR was equivalent to 1 US dollar during 2000 - 2003. | |||||
| Total | 165 | 67.3 | 40 | 32.5 | |
| Individual | |||||
| Age at diagnosis | |||||
| 30 - 39 | 37 (22.4) | 70.3 | 45.9 | 37.3 | |
| 40 - 49 | 53 (32.1) | 66.0 | 39.6 | 34.0 | |
| 50+ | 75 (45.5) | 66.7 | 37.3 | 29.1 | 0.5458 |
| Stage of disease | |||||
| Stage I | 18 (10.9) | 88.9 | 83.3 | 77.6 | |
| Stage II | 32 (19.4) | 68.8 | 37.5 | 21.4 | |
| Stage III | 62 (37.6) | 69.4 | 35.4 | 25.3 | |
| Stage IV | 11 (6.7) | 36.4 | 9.1 | 9.1 | |
| Unknown | 42 (25.5) | 61.9 | 38.1 | 35.7 | 0.0023 |
| Education* | |||||
| No schooling | 145 (87.9) | 66.9 | 37.9 | 30.9 | |
| Some schooling | 17 (10.3) | 82.4 | 64.5 | 51.6 | 0.1794 |
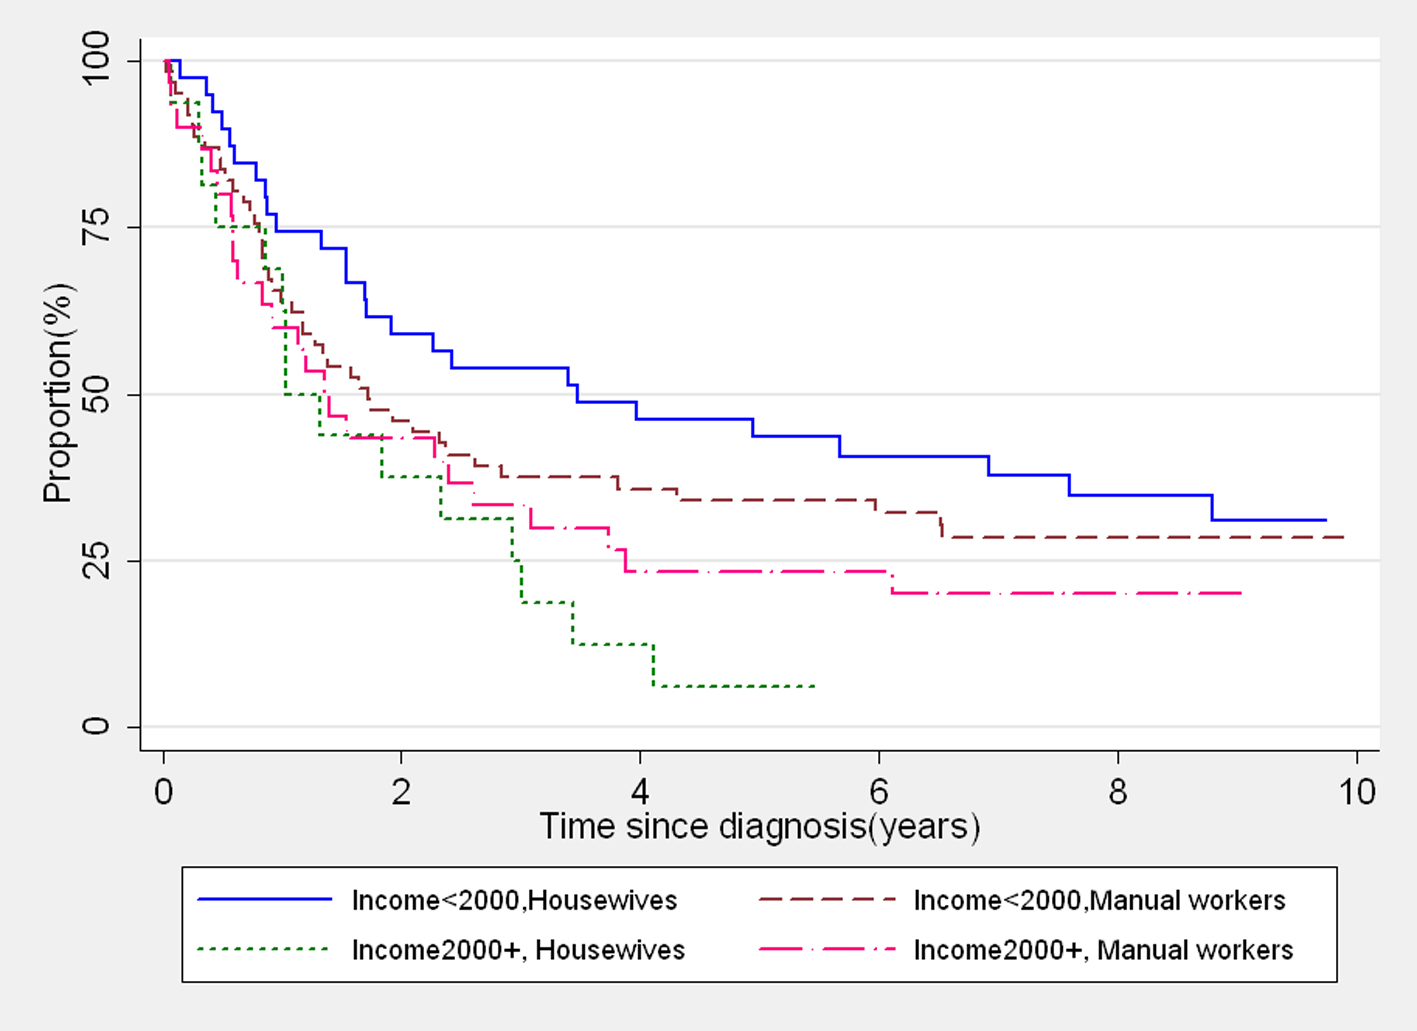
| Occupation | |||||
| House wife/others | 60 (36.4) | 73.3 | 48.3 | 36.4 | |
| Manual | 105 (63.6) | 63.8 | 35.2 | 30.3 | 0.3117 |
| Marital status | |||||
| Currently married | 146 (88.5) | 66.4 | 39.7 | 31.3 | |
| Widowed/separated | 19 (11.5) | 73.7 | 42.1 | 42.1 | 0.4668 |
| Household | |||||
| Type of house | |||||
| Thatched | 27 (16.4) | 48.2 | 29.6 | 25.9 | |
| Tiled/concrete | 138 (83.6) | 71.0 | 42.0 | 33.8 | 0.2588 |
| Income (INR) | |||||
| < 2,000 | 117 (70.9) | 69.2 | 43.5 | 38.2 | |
| 2,000+ | 48 (29.1) | 62.5 | 31.3 | 18.8 | 0.0143 |
| Women’s characteristics | Crude hazard ratio (95% CI) | Adjusted* hazard ratio (95% CI) |
|---|---|---|
| *All variables were included in the regression model. CI: confidence interval; INR: Indian Rupees. 50 INR was equivalent to 1 US dollar during 2000 - 2003. | ||
| Individual | ||
| Age at diagnosis | ||
| 30 - 39 | 1 | 1 |
| 40 - 49 | 1.13 (0.68 - 1.90) | 1.24 (0.73 - 2.14) |
| 50+ | 1.29 (0.80 - 2.08) | 1.38 (0.83 - 2.32) |
| Stage of disease | ||
| Stage I | 1 | 1 |
| Stage II | 3.15 (1.36 - 7.31) | 3.81 (1.54 - 9.40) |
| Stage III | 3.12 (1.40 - 6.91) | 3.67 (1.56 - 8.64) |
| Stage IV | 6.77 (2.56 - 17.91 | 6.74 (2.34 - 19.02) |
| Unknown | 3.00 (1.31 - 6.83) | 3.51 (1.44 - 8.54) |
| Education | ||
| No schooling | 1 | 1 |
| Some schooling | 0.64 (0.33 - 1.23) | 0.71 (0.35 - 1.40) |
| Occupation | ||
| House wife/others | 1 | 1 |
| Manual | 1.21 (0.83 - 1.77) | 1.11 (0.74 - 1.68) |
| Marital status | ||
| Currently married | 1 | 1 |
| Widowed/separated | 0.80 (0.44 - 1.45) | 0.68 (0.35 - 1.32) |
| Household | ||
| Type of house | ||
| Thatched | 1 | 1 |
| Tiled/concrete | 0.75 (0.47 - 1.22) | 0.68 (0.39 - 1.18) |
| Income (INR) | ||
| < 2,000 | 1 | 1 |
| 2,000+ | 1.60 (1.09 - 2.33) | 1.59 (1.05 - 2.41) |