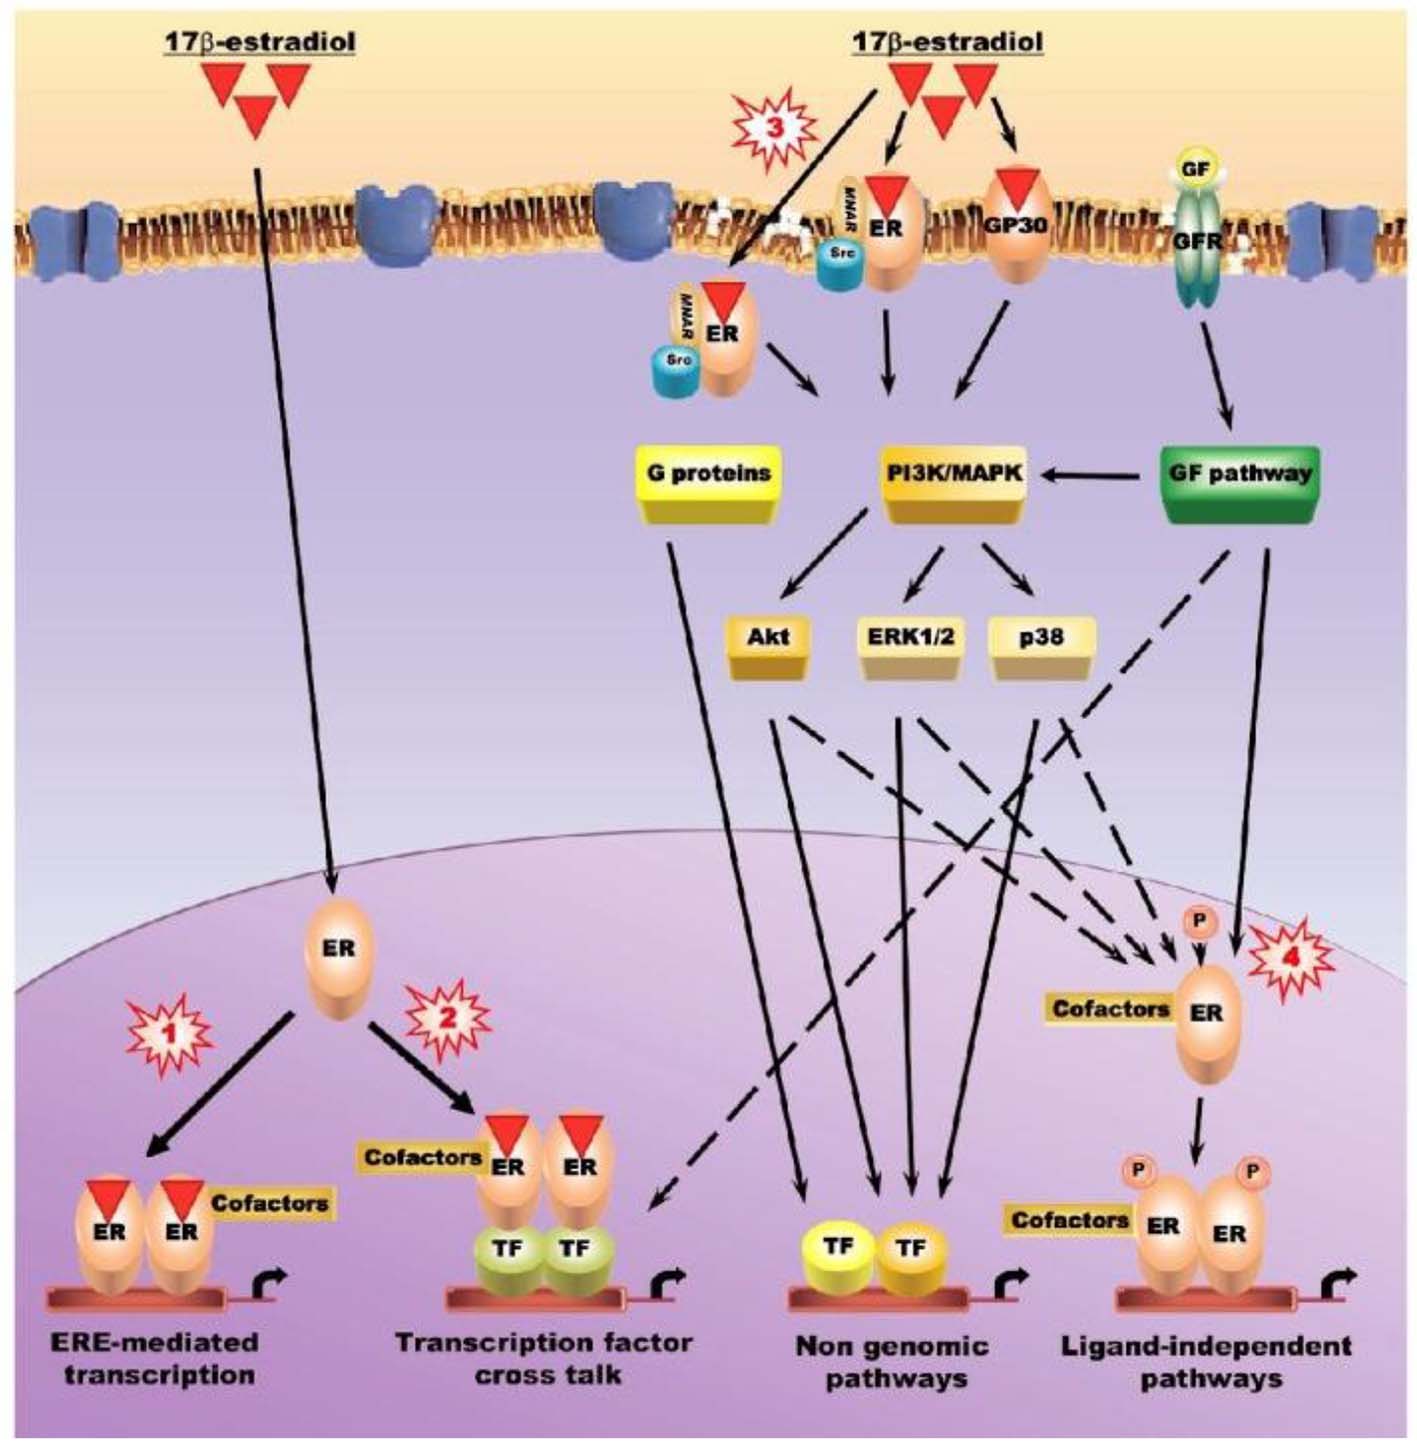
Figure 1. Intracellular signaling pathways used to regulate the activity of estrogens, estrogen receptors, and selective estrogen receptor modulators on articular tissues. Pathway 1: canonical estrogen signaling pathway (estrogen response element (ERE)-dependent) - ligand-activated estrogen receptors (ERs) bind specifically to EREs in the promoter of target genes. Pathway 2: non-ERE estrogen signaling pathway - ligand-bound ERs interact with other transcription factors, such as activator protein (AP)-1, NF-κB and Sp1, forming complexes that mediate the transcription of genes whose promoters do not harbor EREs. Co-regulator molecules regulate the activity of the transcriptional complexes. Pathway 3: non-genomic estrogen signaling pathways - ERs and GP30 localized at or near the cell membrane might elicit the rapid response by activating the phosphatidylinositol-3/Akt (PI3K/Akt) and/or protein kinase C/mitogen activated protein kinase (PKC/MAPK) signal transduction pathways. Pathway 4: ligand-independent pathways - ERs can be stimulated by growth factors such as insulin-like growth factor (IGF)-1, transforming growth factor-β/mothers against decapentaplegic (TGF-β/SMAD), epidermal growth factor (EGF) and the Wnt/β-catenin signaling pathway in the absence of ligands, either by direct interaction or by MAP and PI3/Akt kinase-mediated phosphorylation. Since members of these signaling pathways are transcription factors, some of them, such as SMADs 3/4, can elicit estrogen responses by interacting with ER in the non-ERE-dependent genomic pathway. ERK: extracellular signal regulated kinase; GF: growth factor; GFR: growth factor receptor; MNAR: modulator of non-genomic action of estrogen receptors; TF: transcription factor.