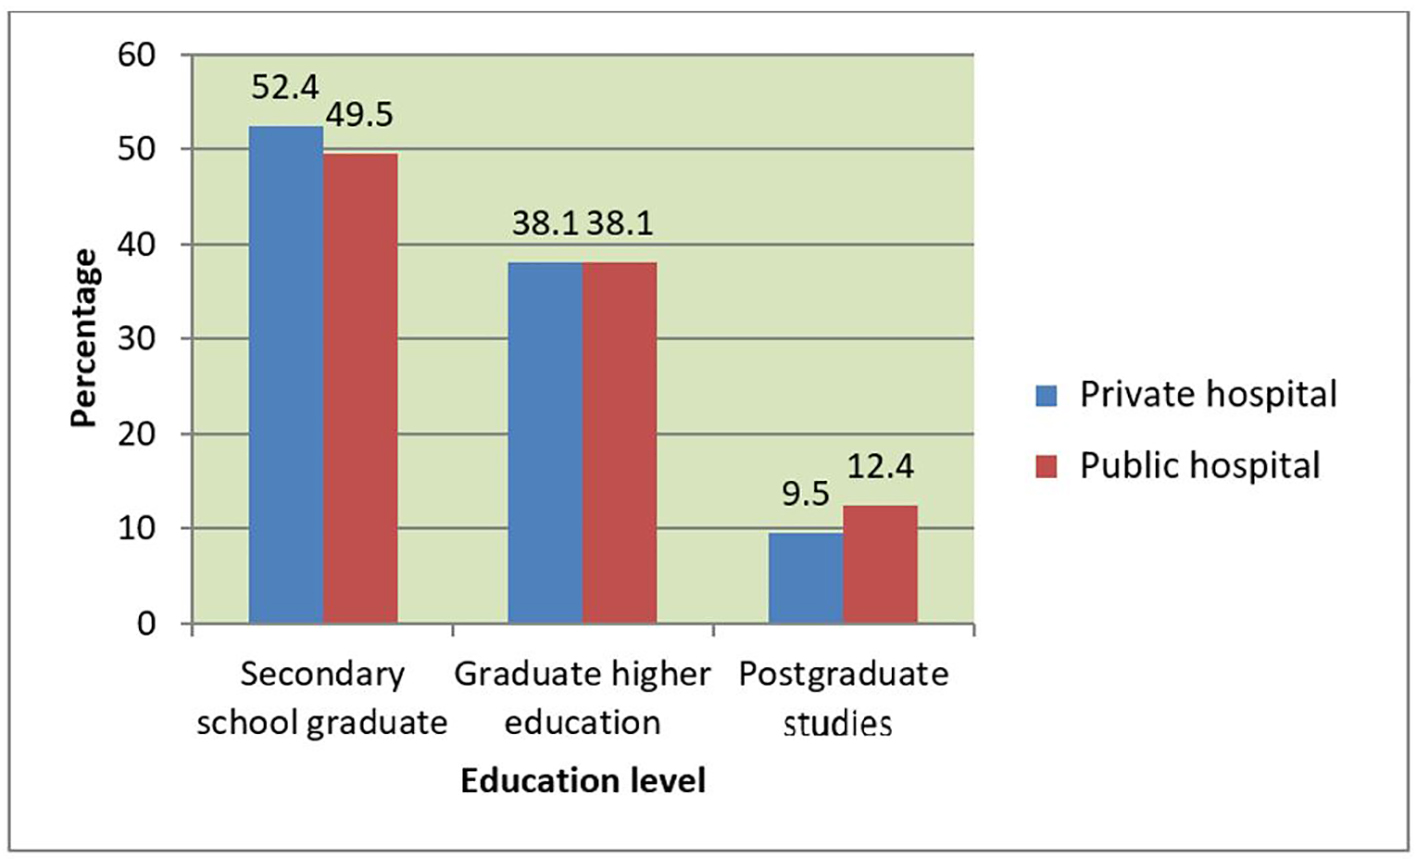
Figure 1. Women’s education level and its association with hospital type (percentage).
| Journal of Clinical Gynecology and Obstetrics, ISSN 1927-1271 print, 1927-128X online, Open Access |
| Article copyright, the authors; Journal compilation copyright, J Clin Gynecol Obstet and Elmer Press Inc |
| Journal website http://www.jcgo.org |
Original Article
Volume 7, Number 1, March 2018, pages 1-12
Evaluating Women’s Satisfaction With Health Services Received During Childbirth: A Study of Hospitals in Athens, Greece
Figures
Tables
| Ν | Percentage (%) | ||
|---|---|---|---|
| Average age (years) | 35.5 ± 4.6 | Public: 35 Private: 36.6 | |
| Basic training | Primary school (6 years) | 0 | 0 |
| First secondary education school (gymnasium 3 years) | 3 | 2.2 | |
| Second secondary education school (lyceum 3 years) | 136 | 97.8 | |
| Educational level | Secondary school graduate | 70 | 50.4 Public: 49.5 Private: 52.4 |
| Graduate higher education | 53 | 38.1 Public: 38.1 Private: 38.1 | |
| Postgraduate studies | 16 | 11.5 Public: 12.4 Private: 9.5 | |
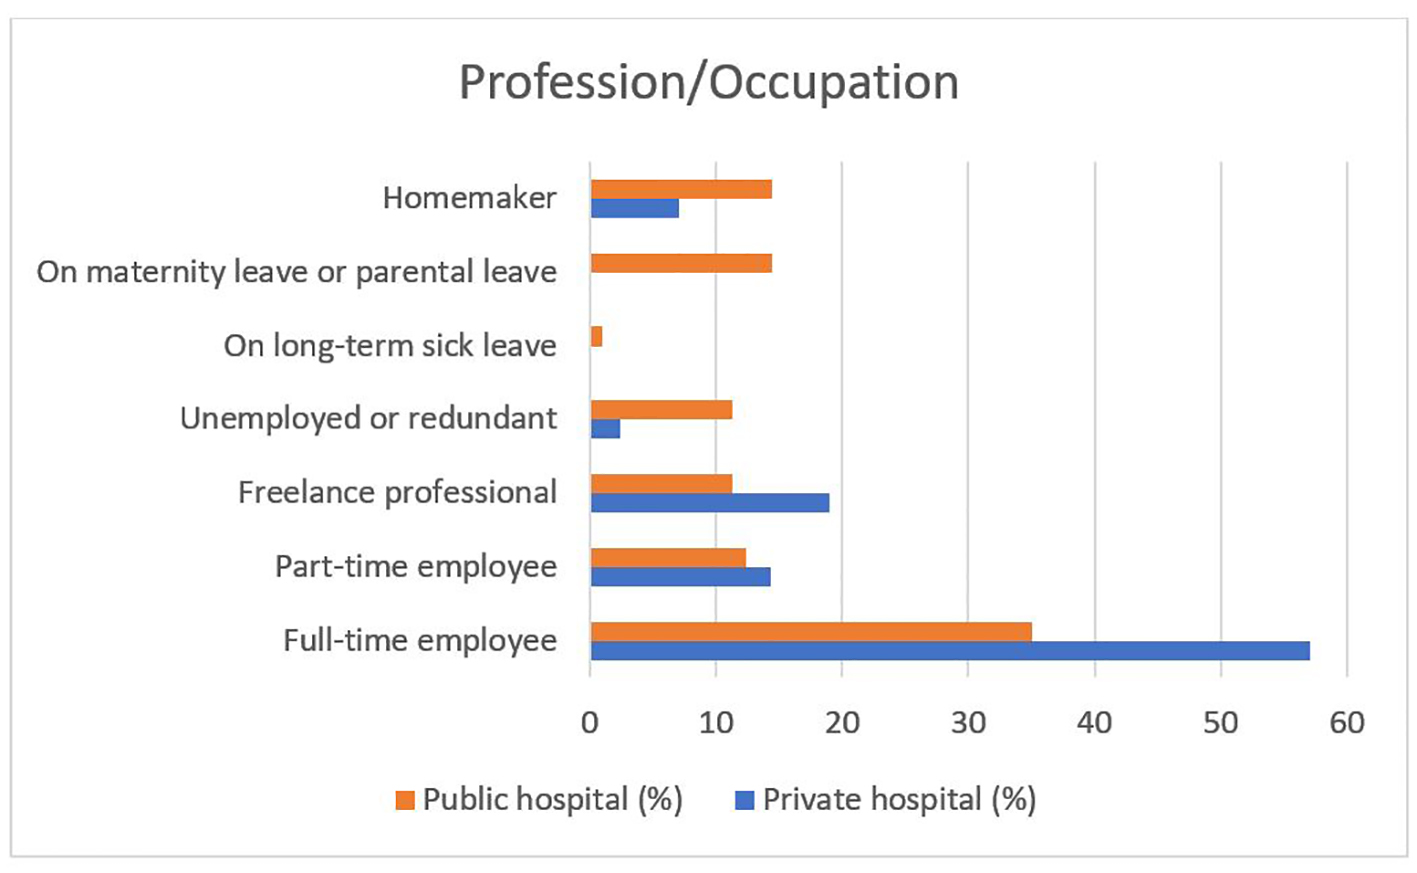
| Professional status | Full-time employee | 58 | 41.7 Public: 35.1 Private: 57.1 |
| Part-time employee | 18 | 12.9 Public: 12.4 Private: 14.3 | |
| Self-employed | 19 | 13.7 Public: 11.3 Private: 19.0 | |
| Unemployed or fired | 12 | 8.6 Public: 11.3 Private: 2.4 | |
| In long-term sick leave | 1 | 0.7 Public: 1.0 Private: 0 | |
| On maternity leave or parental leave | 14 | 10.1 Public: 14.4 Private: 0 | |
| Employed with household | 17 | 12.2 Public: 14.4 Private: 7.1 | |
| Marital status | Single | 4 | 2.9 Public: 0 Private: 9.5 |
| In symbiosis | 16 | 11.5 Public: 12.4 Private: 9.5 | |
| Married | 116 | 83.5 Public: 86.6 Private: 76.2 | |
| Divorced or separated | 2 | 1.4 Public: 1.0 Private: 2.4 | |
| Widow | 1 | 0.7 Public: 0 Private: 2.4 | |
| Birth number | The first | 74 | 53.2 |
| The second or above | 65 | 46.8 | |
| Number of miscarriages or abortions | 0 | 103 | 74.1 |
| 1 | 26 | 18.7 | |
| 2 | 7 | 5 | |
| 3 | 2 | 1.4 | |
| 4 | 0 | 0 | |
| 5 | 1 | 0.7 | |
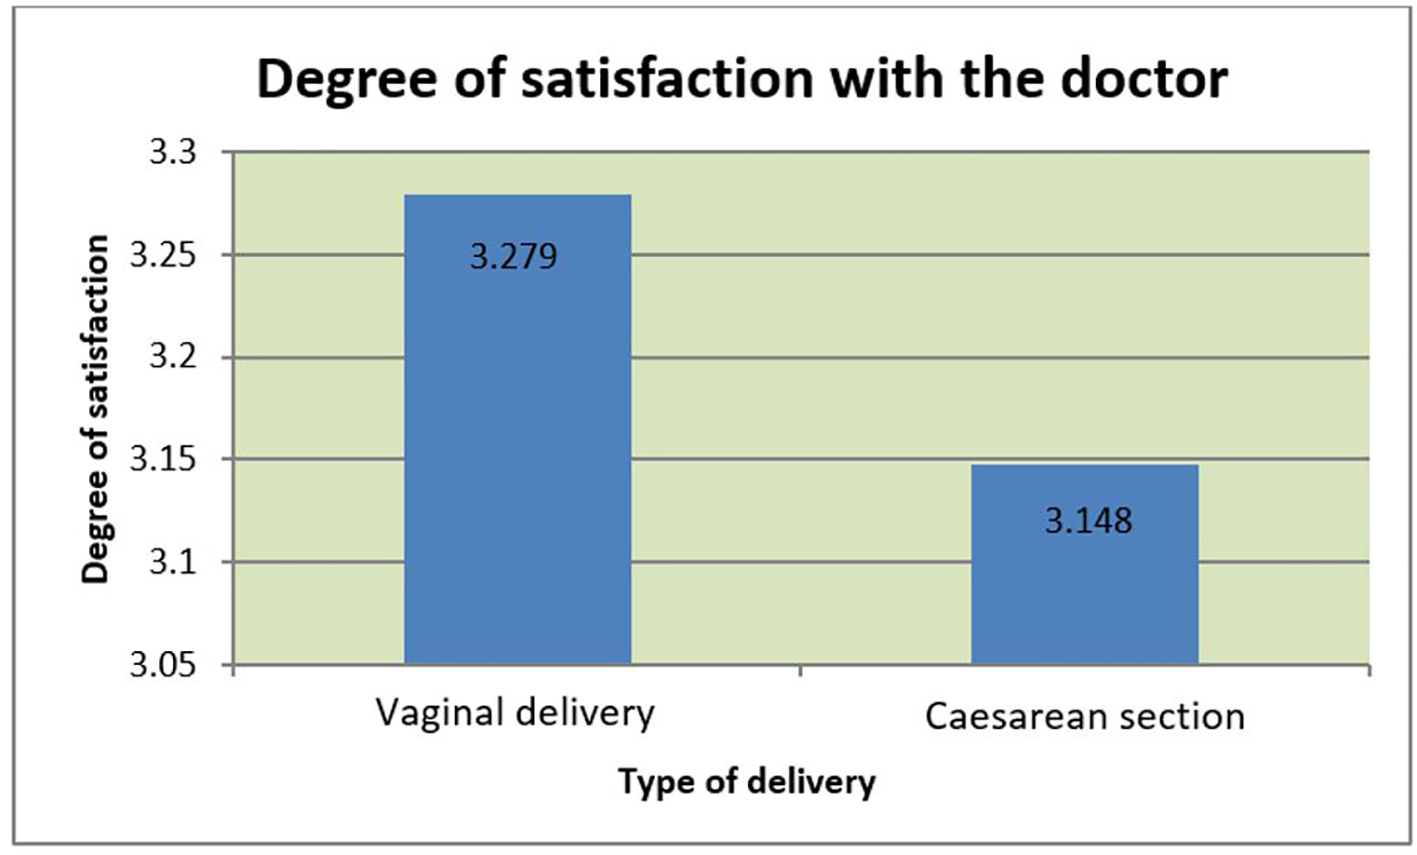
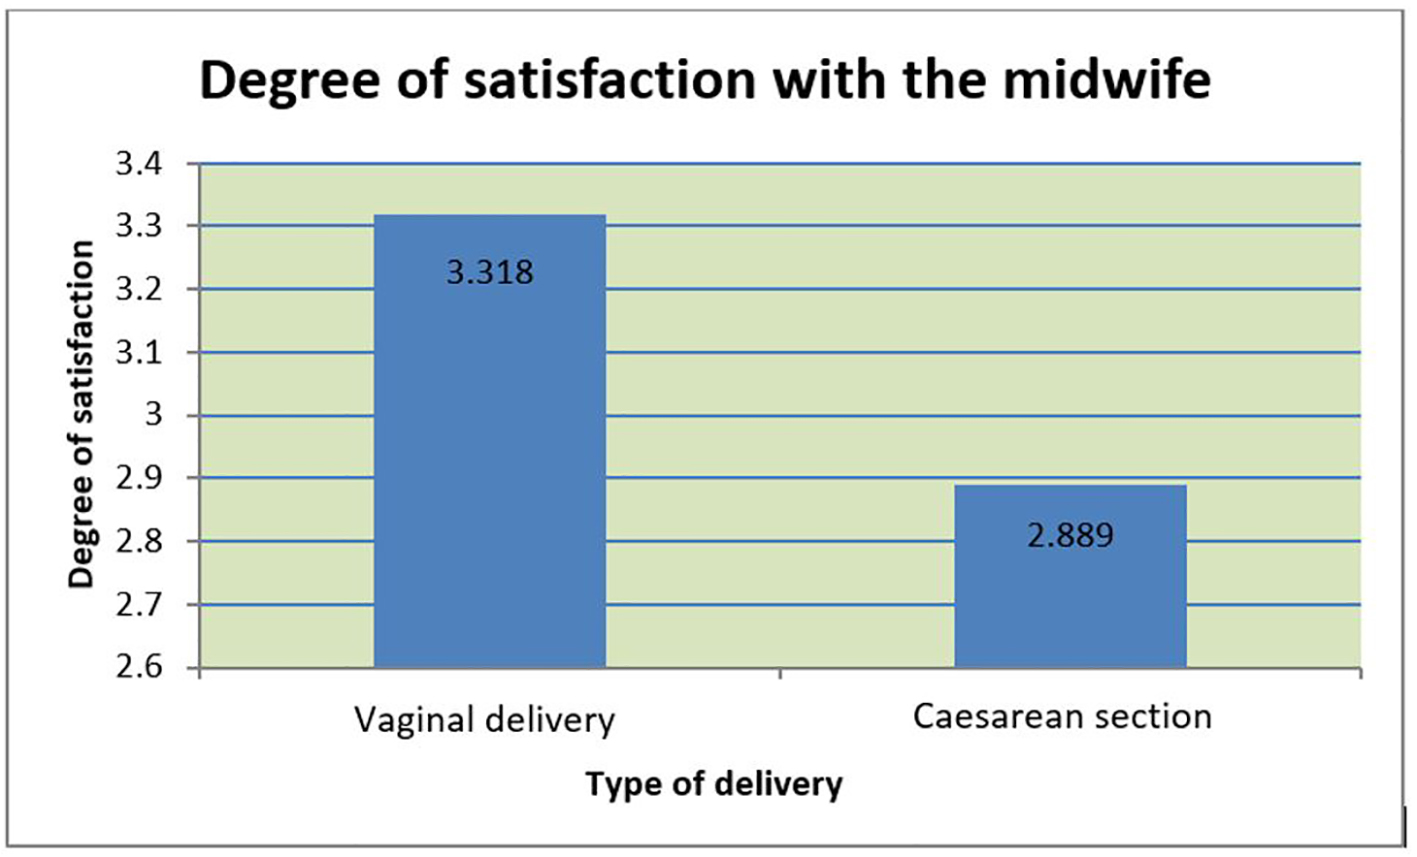
| Kind of current childbirth | Vaginal birth | 81 | 58.3 Public: 56.7 Private: 61.9 |
| Cesarean section | 58 | 41.7 Public: 43.3 Private: 38.1 | |
| Birth preference | With vaginal birth | 120 | 86.3 |
| With cesarean section | 19 | 13.7 | |
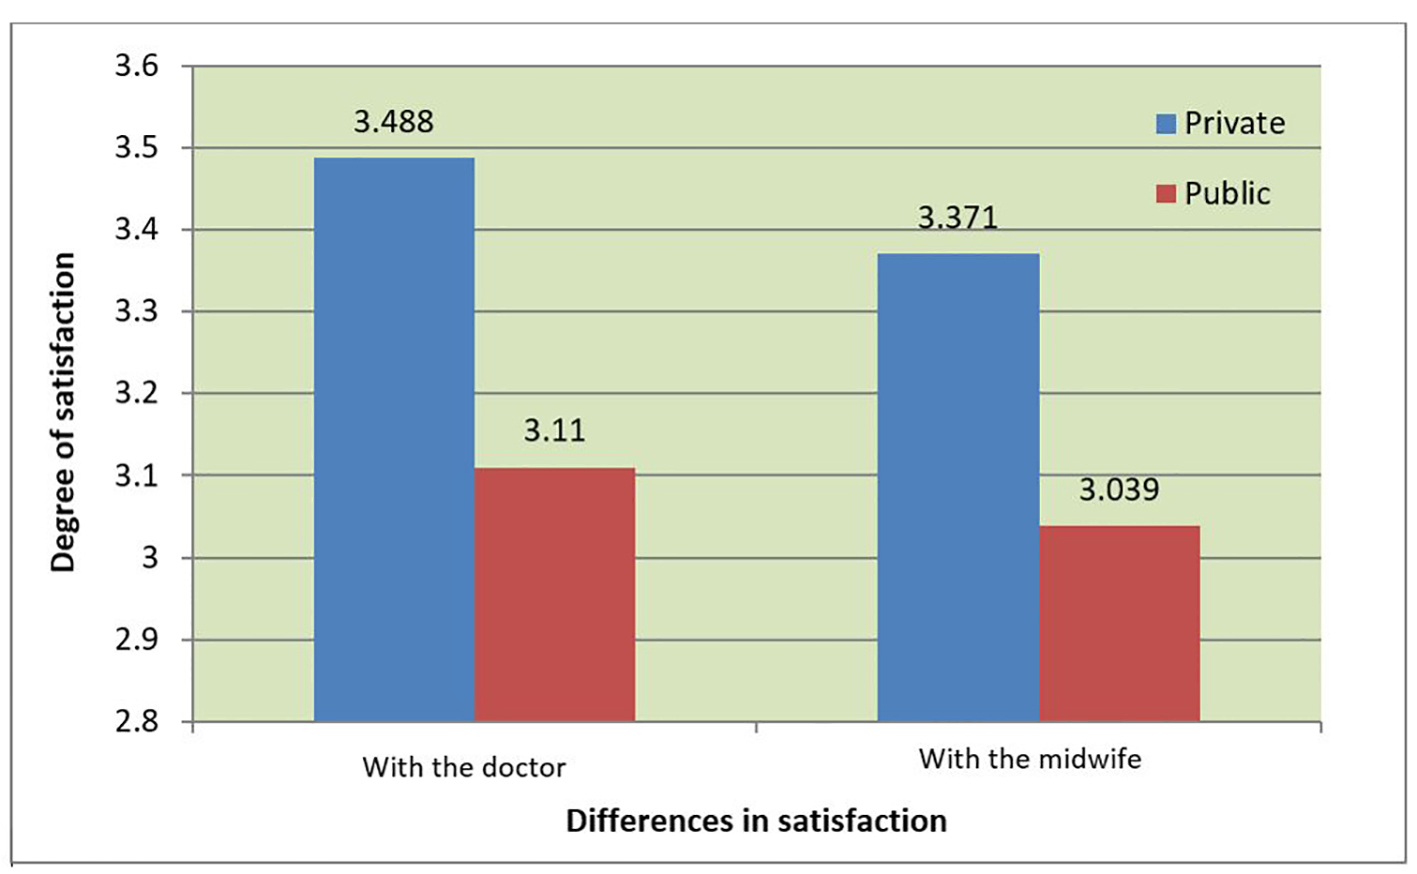
| Hospital of birth | Private | 42 | 30.2 |
| Public | 97 | 69.8 |
| Marital status | Private hospital (%) | Public hospital (%) |
|---|---|---|
| Single | 9.5 | 0 |
| Cohabitating | 9.5 | 12.4 |
| Married | 76.2 | 86.6 |
| Divorced or separated | 2.4 | 1.0 |
| Widowed | 2.4 | 0 |
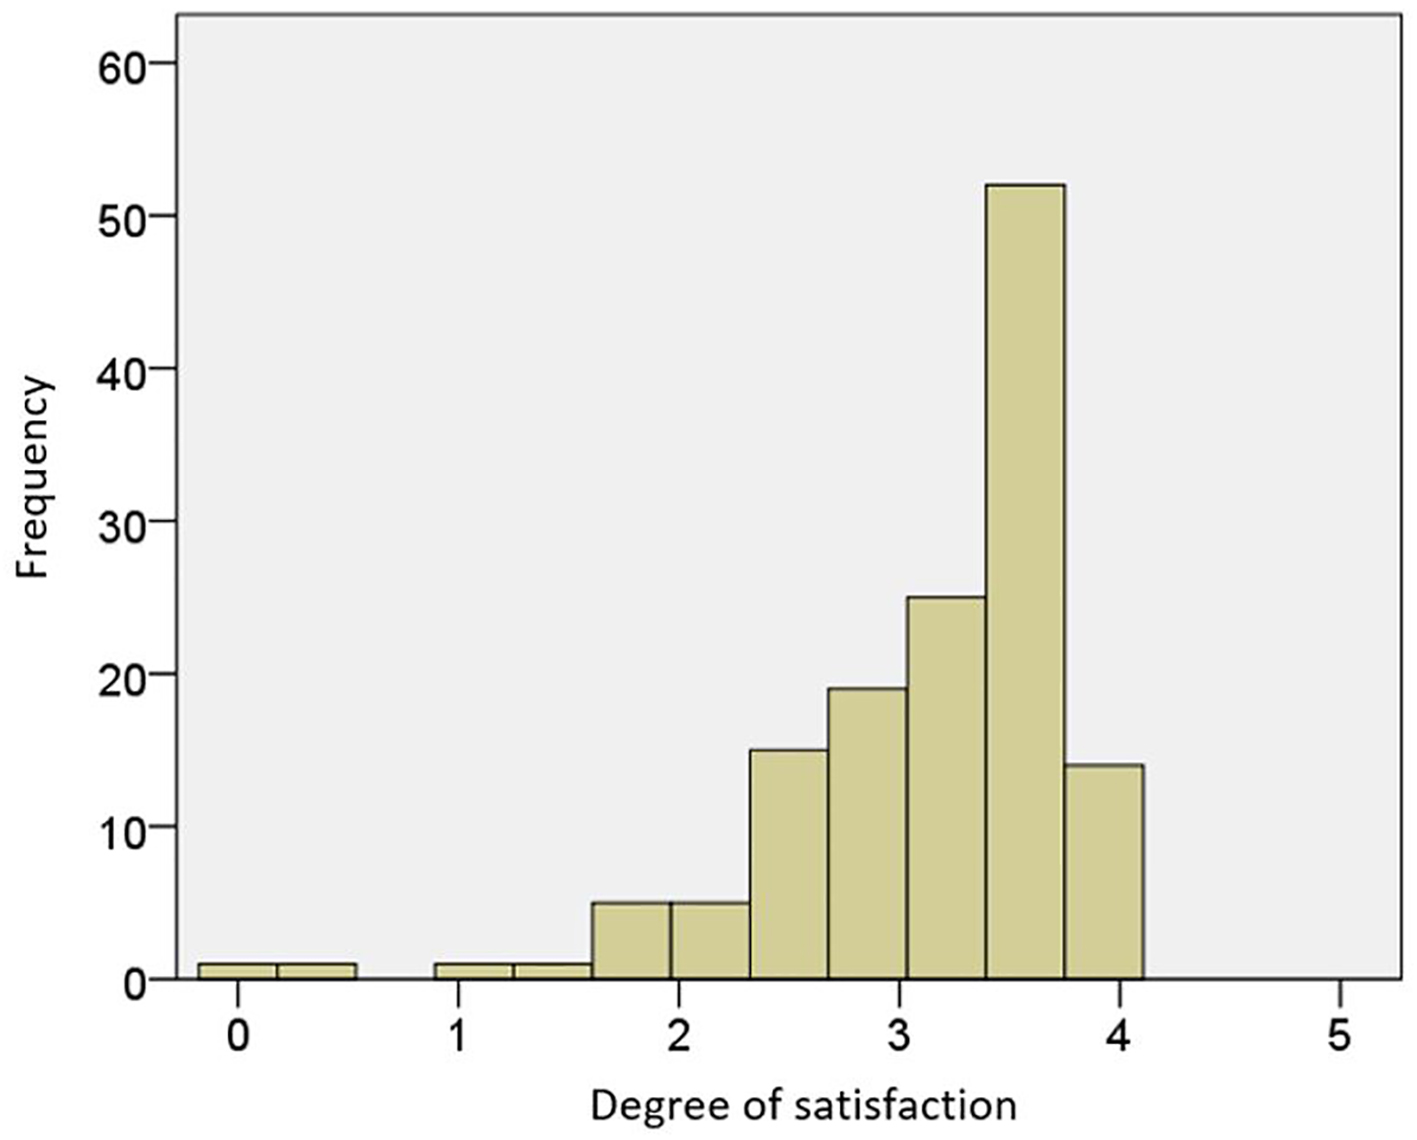
| N | Minimum value | Maximum value | Middle value | Standard deviation | |
|---|---|---|---|---|---|
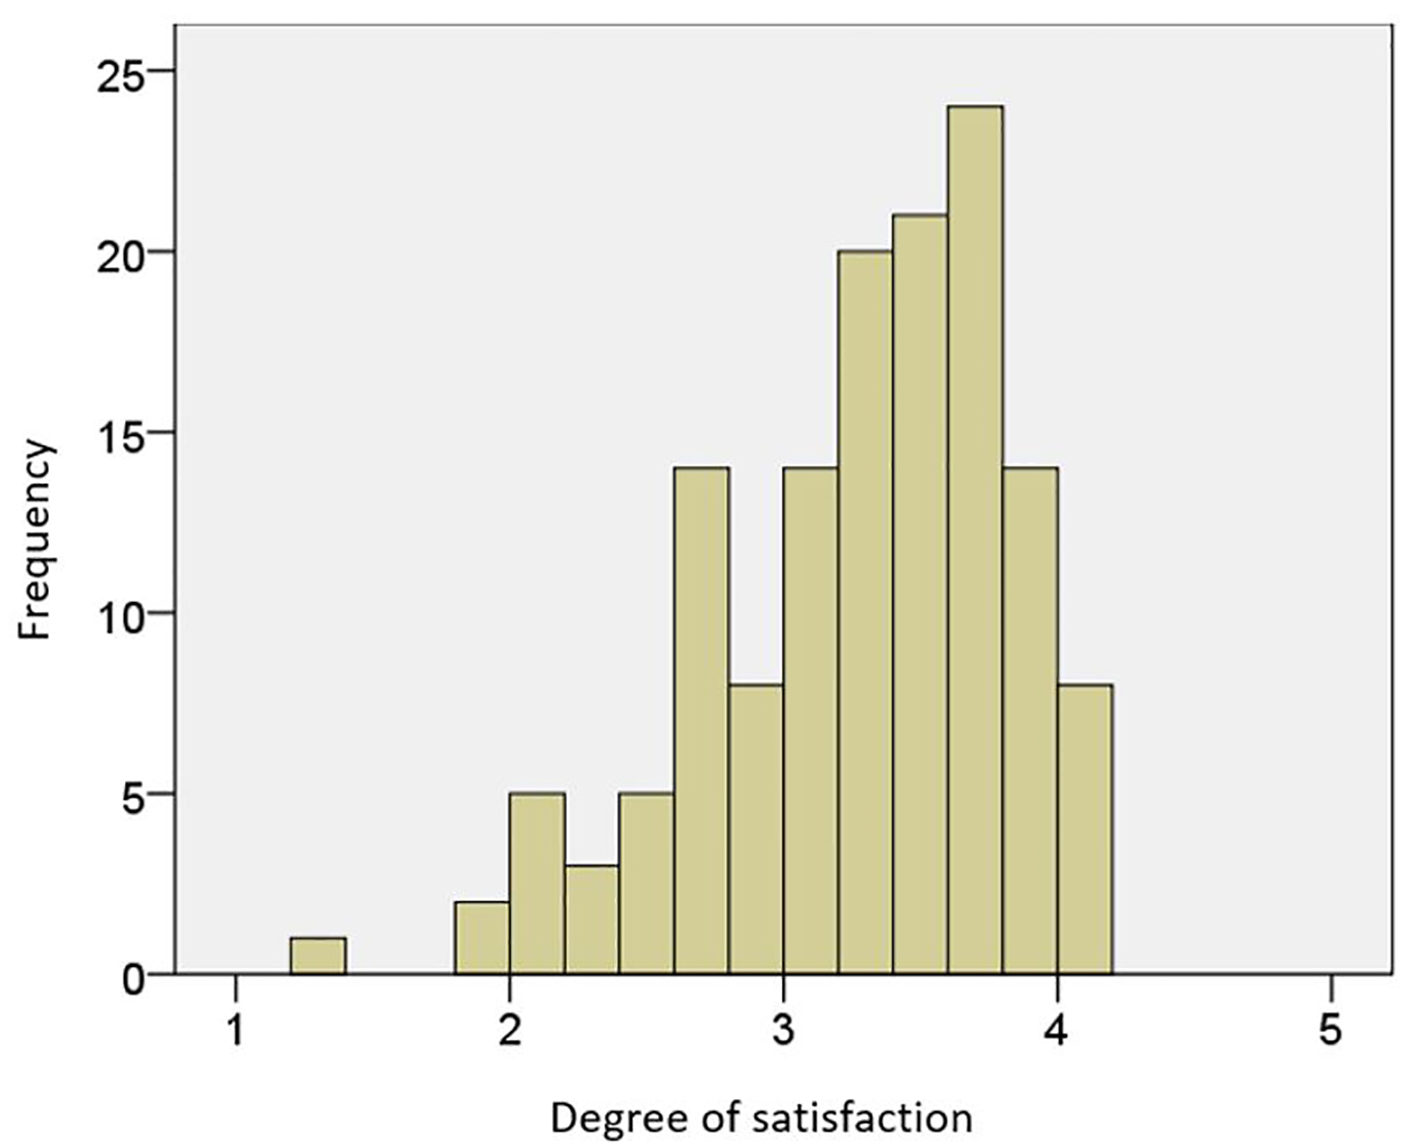
| Satisfaction with doctor | 139 | 1.3 | 4.0 | 3.2 | 0.5 |
| Satisfaction with midwife | 139 | 0 | 4.0 | 3.1 | 0.7 |
| Spearman correlation coefficient (r) | Satisfaction with doctor | Satisfaction with midwife | |
|---|---|---|---|
| Age | r | -0.175 | 0.013 |
| P-value (two-tailed) | 0.039 | 0.881 | |
| N | 139 | 139 | |
| Spearman correlation coefficient | Total satisfaction | Satisfaction with doctor | Satisfaction with midwife | |
|---|---|---|---|---|
| Vocational education level | r | -0.288 | -0.367 | -0.245 |
| P-value (two-tailed) | 0.065 | 0.017 | 0.118 | |
| n | 42 | 42 | 42 | |
| Spearman correlation coefficient | Total satisfaction | Satisfaction with doctor | Satisfaction with midwife | |
|---|---|---|---|---|
| Vocational education level | r | 0.109 | 0.111 | 0.115 |
| P-value (two-tailed) | 0.287 | 0.279 | 0.261 | |
| n | 97 | 97 | 97 | |
| Spearman correlation coefficient (r) | Degree of satisfaction with the doctor | Degree of satisfaction with the midwife | |
|---|---|---|---|
| Negative birth experience | r | -0.361 | -0.308 |
| P-value (two-tailed) | < 0.001 | 0.001 | |
| N | 139 | 139 | |
| Information from the Internet | n | Mean | Standard deviation |
|---|---|---|---|
| Degree of satisfaction with the doctor | |||
| Yes | 105 | 3.160 | 0.571 |
| No | 32 | 3.428 | 0.421 |
| Degree of satisfaction with the midwife | |||
| Yes | 105 | 3.112 | 0.606 |
| No | 32 | 3.326 | 0.790 |
| Degree of satisfaction with the doctor | Degree of satisfaction with the midwife | ||
| Mann-Whitney U test | 1,224.5 | 1,137.5 | |
| P-value | 0.020 | 0.006 | |