Journal of Clinical Gynecology and Obstetrics, ISSN 1927-1271 print, 1927-128X online, Open Access
Article copyright, the authors; Journal compilation copyright, J Clin Gynecol Obstet and Elmer Press Inc
Journal website https://www.jcgo.org

Original Article

Volume 9, Number 4, December 2020, pages 79-95


The Association Between Pelvic Organ Prolapse, Pelvic Pain and Pelvic Reconstructive Surgery Using Transvaginal Mesh: A Secondary Analysis of a Prospective Multicenter Observational Cohort Trial

Figure

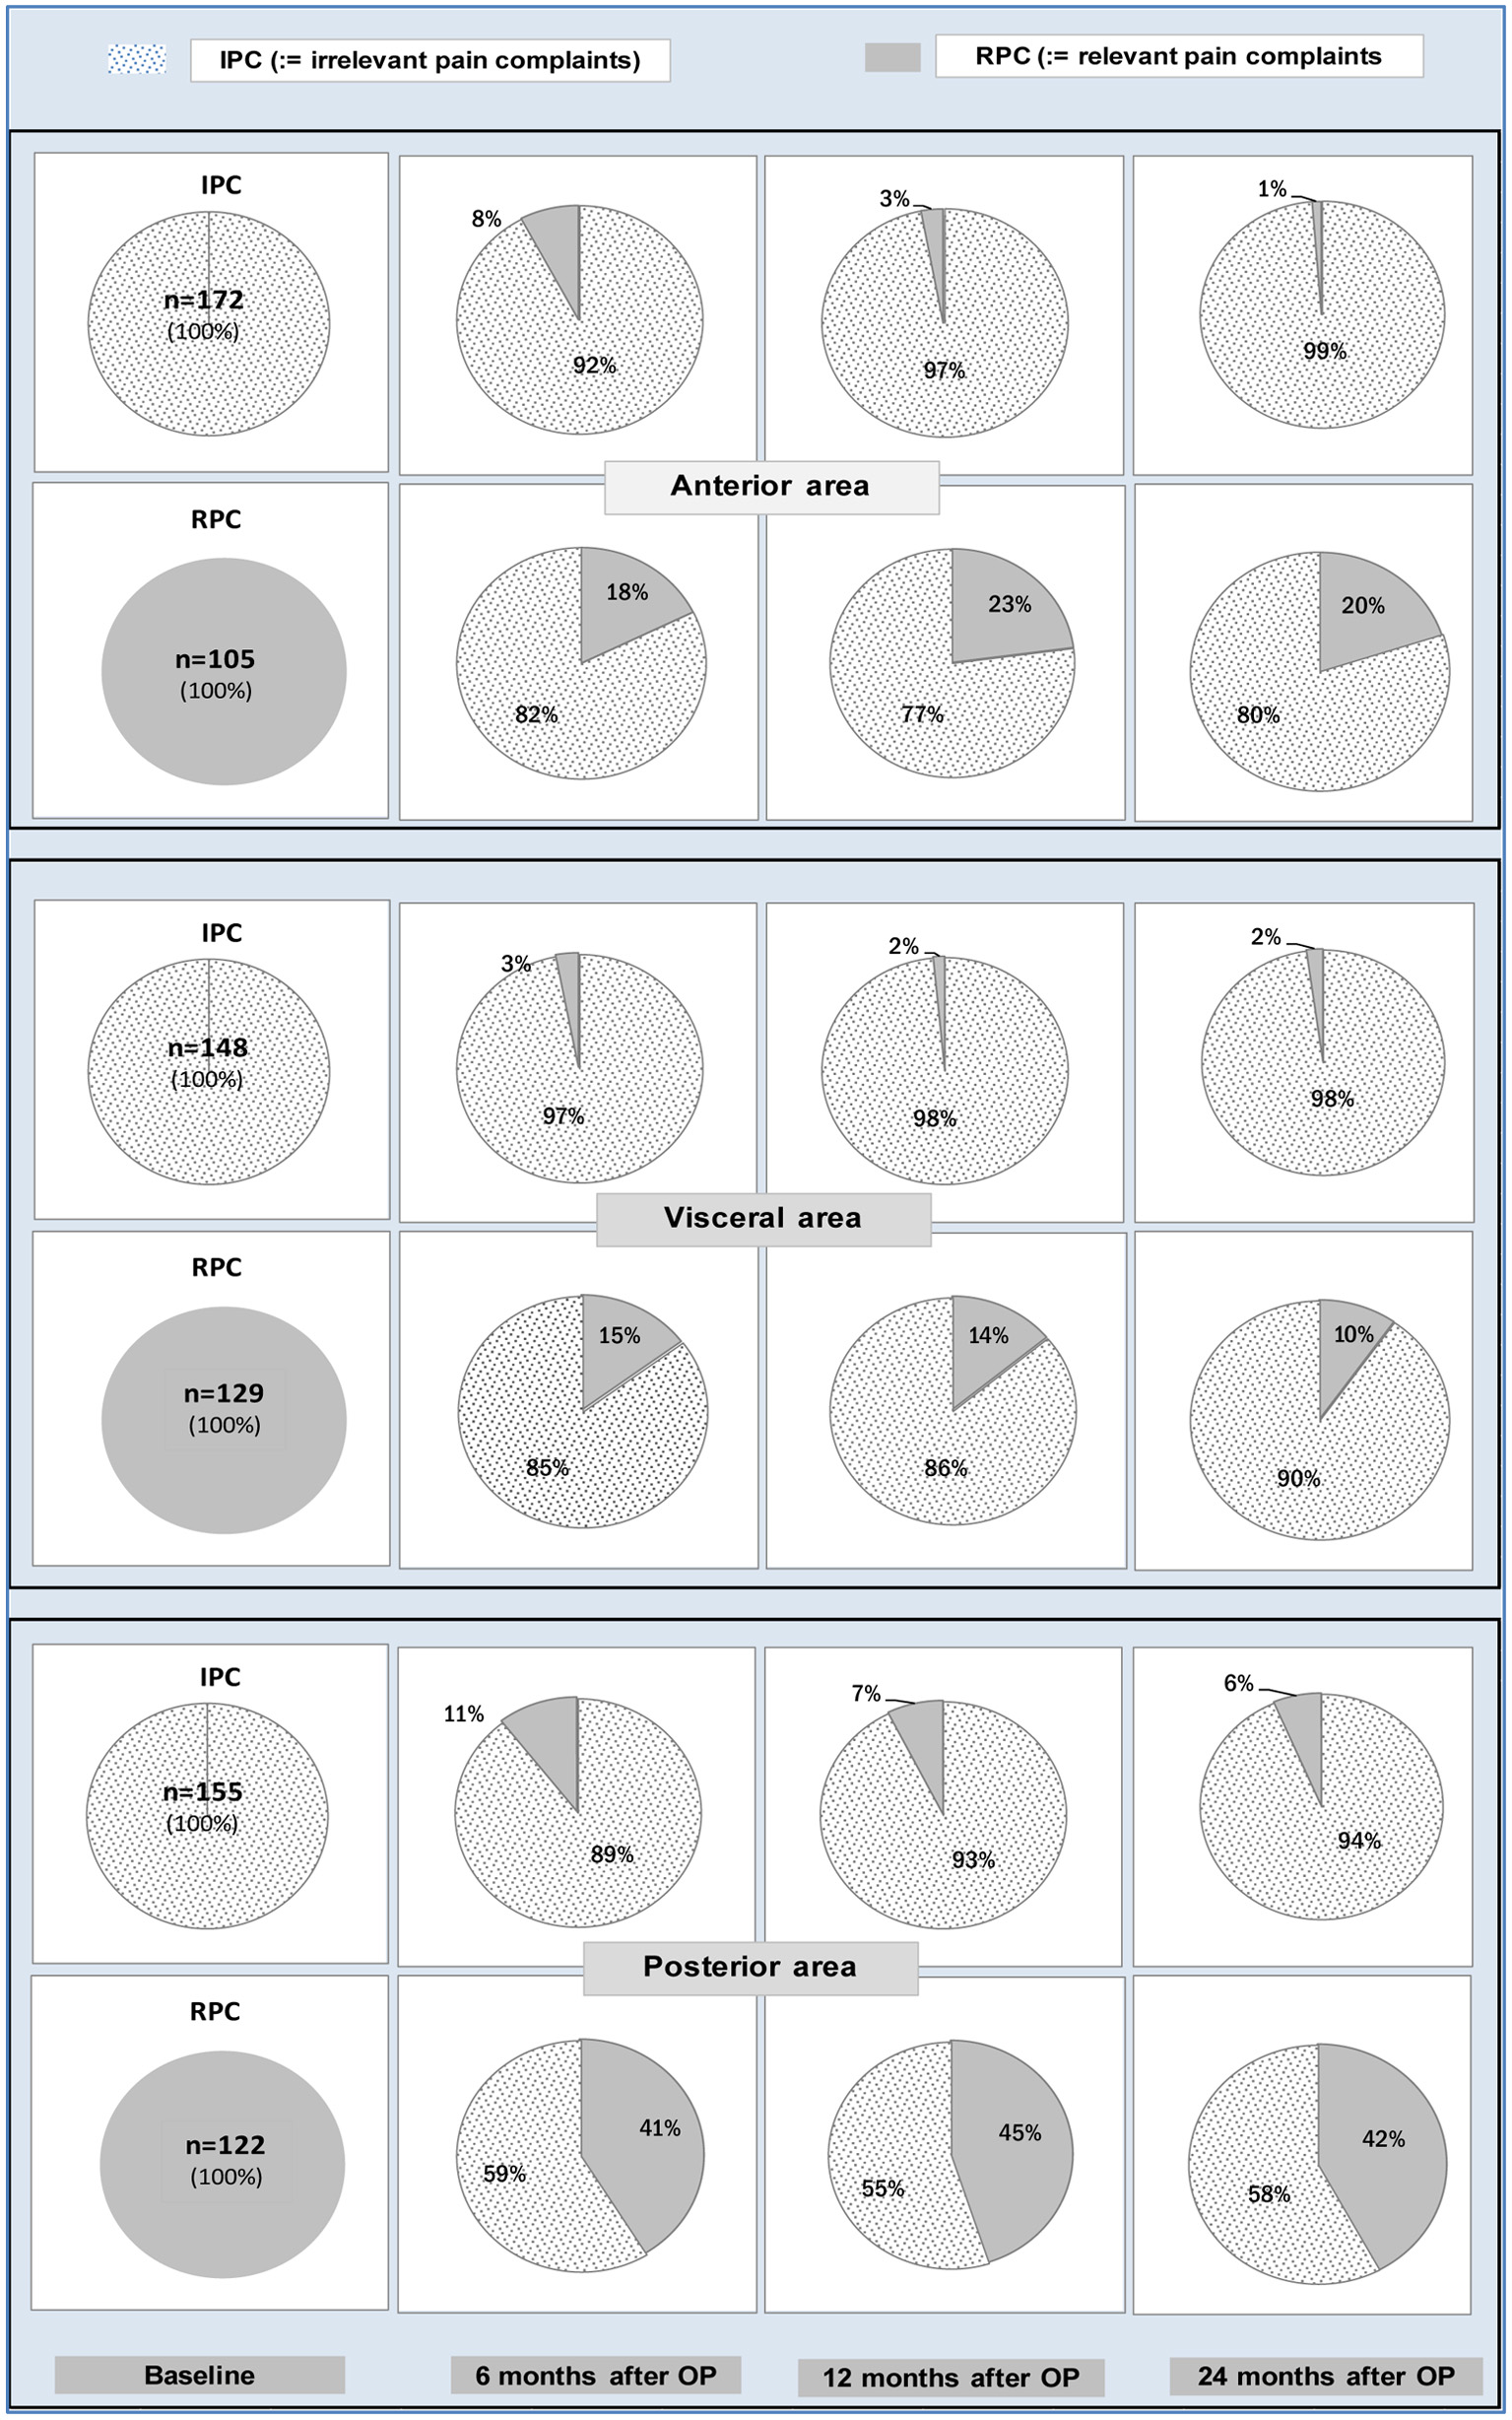
Figure 1.
Figure 1. Proportions of patients who showed preoperatively the IPC state (bottom row of pies) or the RPC state (lower row of pies) for each pain complaint area and who stayed on the same or passed over to the other state 6, 12 or 24 months after surgery. Obviously, patients suffering from anterior or visceral pain at baseline showed better results 6, 12 or 24 months after surgery than patients suffering from posterior pain. IPC: irrelevant pain complaint; RPC: relevant pain complaint.

Tables

Table 1. Baseline Prevalence of the Four Symptom Outcomes and the Combination R2 Regarding the PFDI Symptoms in Patient Groups
 
Preoperative pain symptomsTotal population (n = 277)Posterior/apical (n = 135)Anterior/apical (n = 142)POP-Q stage 2 (n = 122)POP-Q stage 3 or 4 (n = 150)
Absolute frequencyRelative frequencyAbsolute frequencyRelative frequencyAbsolute frequencyRelative frequencyAbsolute frequencyRelative frequencyAbsolute frequencyRelative frequency
The pairwise superscripts “a”, “b”, “c” and “d” on the relative frequencies of certain symptoms indicate significant differences between the posterior/apical and anterior/apical groups in terms of the prevalence rates of R2 (Fisher’s exact tests, P < 0.05). PFDI: pelvic floor disorder inventory; POP-Q: pelvic organ prolapse quantification system.
PFDI 1 (pressure in the lower abdomen)
  Symptom-free13147.30%5641.50%7552.80%5545.10%7348.70%
  Somewhat5519.90%2921.50%2618.30%2419.70%3020.00%
  Moderate4717.00%2317.00%2416.90%2016.40%2718.00%
  Quite a bit4415.90%2720.00%1712.00%2318.90%2013.30%
  R2 (moderate or quite a bit)9132.90%5037.00%a4128.90%a4335.30%4731.30%
  Observed cases277100.0%135100.0%142100.0%122100.0%150100.0%
PFDI 2 (pain in the lower abdomen or genital area)
  Symptom-free16760.30%7454.80%9365.50%7561.50%9060.00%
  Somewhat4717.00%2317.00%2416.90%1814.80%2818.70%
  Moderate3713.40%2518.50%128.50%1613.10%1912.70%
  Quite a bit269.40%139.60%139.20%1310.70%138.70%
  R2 (moderate or quite a bit)6322.80%3828.10%b2517.70%b2923.80%3221.40%
  Observed cases277100.0%135100.0%142100.0%122100.0%150100.0%
PFDI 3 (heaviness or dullness in the pelvic area)
  Symptom-free14150.90%6346.70%7854.90%6250.80%7751.30%
  Somewhat6122.00%2619.30%3524.60%2722.10%3322.00%
  Moderate3914.10%2417.80%1510.60%1310.70%2516.70%
  Quite a bit3613.00%2216.30%149.90%2016.40%1510.00%
  R2 (moderate or quite a bit)7527.10%4634.10%c2920.50%c3327.10%4026.70%
  Observed cases277100.0%135100.0%142100.0%122100.0%150100.0%
PFDI 6 (pelvic discomfort during standing or physical exertion)
  Symptom-free10738.60%5641.50%5135.90%5343.40%5134.00%
  Somewhat5720.60%2317.00%3423.90%2117.20%3624.00%
  Moderate5820.90%2921.50%2920.40%2318.90%3422.70%
  Quite a bit5519.90%2720.00%2819.70%2520.50%2919.30%
  R2 (moderate or quite a bit)11340.80%5641.50%5740.10%4839.40%6342.00%
  Observed cases277100.0%135100.0%142100.0%122100.0%150100.0%
PFDI 7 (pain in lower back most days)
  Symptom-free12645.50%5440.00%7250.70%5645.90%6845.30%
  Somewhat4616.60%2317.00%2316.20%2016.40%2416.00%
  Moderate4215.20%2417.80%1812.70%1512.30%2617.30%
  Quite a bit6322.70%3425.20%2920.40%3125.40%3221.30%
  R2 (moderate or quite a bit)10537.90%5843.00%d4733.10%d4637.70%5838.60%
  Observed cases277100.0%135100.0%142100.0%122100.0%150100.0%
PFDI 46 (abdominal or lower back pain when straining for any reason)
  Symptom-free16760.30%7152.60%9667.60%6855.70%9563.30%
  Somewhat4215.20%2720.00%1510.60%2520.50%1711.30%
  Moderate3613.00%2115.60%1510.60%1713.90%1812.00%
  Quite a bit3211.60%1611.90%1611.30%129.80%2013.30%
  R2 (moderate or quite a bit)6824.60%3727.50%3121.90%2923.70%3825.30%
  Observed cases277100.0%135100.0%142100.0%122100.0%150100.0%


Table 2. Absolute and Relative Frequencies of the IPCs and RPCs in the Anterior, Visceral, Posterior and the Whole Pain Complaint Area (All Areas) for Different Patient Samples Preoperatively
 
Location of pain symptomsPrevalences of the irrelevant and relevant pain complaints in the front, visceral, back and all areas into different samples in the baseline
Total sample (n = 277)Posterior/apical (n = 135)Anterior/apical (n = 142)X2-tests for testing posterior/apical vs. anterior/apical (P-values)POP-Q stage 2 (n = 122)POP-Q stage 3 or 4 (n = 150)X2-tests for testing stage 2 vs. stage 3 or 4 (P-values)
Absolute frequencyRelative frequencyAbsolute frequencyRelative frequencyAbsolute frequencyRelative frequencyAbsolute frequencyRelative frequencyAbsolute frequencyRelative frequency
When considering all complaints, more than 61.30% of the female patients revealed at least one relevant pain symptom, irrespective of the affiliation sample. The area with the least frequent RPCs was the anterior area. For each considered sample, Cochran’s Q-tests followed by the McNemar tests were applied for testing differences between the three areas: anterior area (F), visceral (V) and posterior (B), in terms of the prevalence rates of RPCs, whereas differences in the prevalence rates of PRC between the “paP” and “aaP” groups as well as between the “S2P” and “S34P” groups were tested about significance for each considered area (sympotom domain) with X2-test. “+” indicates significant (marginally significant) area or group differences at a Bonferroni corrected level of significance (nominal level of significance α = 0.05). POP-Q: pelvic organ prolapse quantification system; PFDI: pelvic floor disorder inventory; IPC: irrelevant pain complaint; RPC: relevant pain complaint.
Anterior area (PFDI 1 and PFDI 2)
  IPCs (IPC: PFDI 1 = R1 and PFDI 2 = R1)17262.10%7958.50%9365.50%X2(1) = 1.437460.70%9563.30%X2(1) = 0.20
  RPCs (RPC: PFDI 1 = R2 or PFDI 2 = R2)10537.90%5641.50%4934.50%P = 0.2314839.30%5536.70%P = 0.650
   Total cases277100.00%135100.00%142100.00%122100.00%150100.00%
Visceral area (PFDI 3 and PFDI 6)
  IPCs (IPC: PFDI 3 = R1 and PFDI 6 = R1)14853.40%6749.60%8157.00%X2(1) = 1.526956.60%7650.70%X2(1) = 0.93
  RPCs (RPC: PFDI 3 = R2 or PFDI 6 = R2)12946.60%6850.40%6143.00%P = 0.2165343.40%7449.30%P = 0.332
  Total cases277100.00%135100.00%142100.00%122100,00%150100.00%
Posterior area (PFDI 7 and PFDI 46)
  IPCs (IPC: PFDI 7 = R1 and PFDI 46 = R1)15556.00%6850.40%8761.30%X2(1) = 3.336754.90%8556.70%X2(1) = 0.08
  RPCs (RPC: PFDI 7 = R2 or PFDI 46 = R2)12244.00%6749.60%5538.70%P = 0.0675545.10%6543.30%P = 0.772
  Total cases277100.00%135100.00%142100.00%122100.00%150100.00%
Testing global and simple differences in the occurrence of relevant complaints between regions (Cochran’s Q- and McNemar tests)Q(DF = 2) = 6.92Q(DF = 2) = 3.97Q(DF = 2) = 3.32Q(DF = 2) = 1.25Q(DF = 2) = 7.97
P = 0.0314+P = 0.137P = 0.189P = 0.533P = 0.0186+
F/VF/V
All areas
  IPCs (PFDI: 1, 2, 3, 6, 7 and 46, all PFDIs = R1)9032.50%3525.90%5539.70%X2(1) = 5.523721.30%5134.00%X2(1) = 1.41
  RPCs (at least one of the PFDIs = R2)18767.50%10074.10%8761.30%P = 0.018+8569.70%9966.00%P = 0.519
  Total cases277100.00%135100.00%142100.00%122100.00%150100.00%


Table 3. Absolute and Relative Frequencies of the Four Symptom Outcomes and the Combined Outcome R2 Before and 6, 12 and 24 Months After POP Reconstruction in the Total Population
 
Pre- and postoperative pain symptoms (total population, n = 277)Baseline (phase 0)6 months after surgery (phase 1)12 months after surgery (phase 2)24 months after surgery (phase 3)Cochran’s Q-tests for tesing global effects (P-values)McNemar tests for testing simple effects (phase pairs with significant differences)
Absolute frequencyRelative frequencyAbsolute frequencyRelative frequencyAbsolute frequencyRelative frequencyAbsolute frequencyRelative frequency
Frequencies at each postoperative stage refer to the number of patients who were observed in this stage. The global time effects on the prevalence rates of R2 and of the “symptom-free” outcome were tested for significance with Cochran’s Q-tests. Whenever significant global effects were revealed, McNemar tests were subsequently performed to test the simple effects, i.e., for identifying the phase pairs with significant differences in the investigated prevalence rates. “*” (number pairs) indicates significant global effects on (phase pairs with significant differences in) the investigated prevalence rates at a Bonferroni corrected level of significance α* (where α* < α (= 0.05)). POP: pelvic organ prolapse; PFDI: pelvic floor disorder inventory.
PFDI 1 (pressure in the lower abdomen)
  Symptom-free13147.30%21382.90%21385.90%16388.10%P < 0.00001*0/1, 0/2, 0/3
  Somewhat5519.90%238.90%187.30%126.50%
  Moderate4717.00%145.40%93.60%84.30%
  Quite a bit4415.90%72.70%83.20%21.10%
  R2 (moderate or quite a bit)9132.90%218.10%176.80%105.40%P < 0.00001*0/1, 0/2, 0/3
  Observed cases277100.00%257100.00%248100.00%185100.00%
PFDI 2 (pain in the lower abdomen or genital area)
  Symptom-free16760.30%21784.40%21887.90%17192.40%P < 0.00001*0/1, 0/2, 0/3
  Somewhat4717.00%187.00%166.50%94.90%
  Moderate3713.40%155.80%83.20%31.60%
  Quite a bit269.40%72.70%62.40%21.10%
  R2 (moderate or quite a bit)6322.80%228.50%145.60%52.70%P < 0.00001*0/1, 0/2, 0/3
  Observed cases277100.00%257100.00%248100.00%185100.00%
PFDI 3 (heaviness or dullness in the pelvic area)
  Symptom-free14150.90%22687.90%22389.90%17091.90%P < 0.00001*0/1, 0/2, 0/3
  Somewhat6122.00%228.60%135.20%105.40%
  Moderate3914.10%51.90%62.40%31.60%
  Quite a bit3613.00%41.60%62.40%21.10%
  R2 (moderate or quite a bit)7527.10%93.50%124.80%52.70%P < 0.00001*0/1, 0/2, 0/3
  Observed cases277100.00%257100.00%248100.00%185100.00%
PFDI 6 (pelvic discomfort during standing or pshysically exerting)
  Symptom-free10738.60%21884.80%22490.30%16991.40%P < 0.00001*0/1, 0/2, 0/3
  Somewhat5720.60%197.40%93.60%73.80%
  Moderate5820.90%135.10%124.80%73.80%
  Quite a bit5519.90%72.70%31.20%21.10%
  R2 (moderate or quite a bit)11340.80%207.80%156.00%94.90%P < 0.00001*0/1, 0/2, 0/3
  Observed cases277100.00%257100.00%248100.00%185100.00%
PFDI 7 (pain in lower back most days)
  Symptom-free12645.50%18270.80%17871.80%13975.10%P < 0.00001*0/1, 0/2, 0/3
  Somewhat4616.60%259.70%228.90%137.00%
  Moderate4215.20%259.70%197.70%179.20%
  Quite a bit6322.70%259.70%2911.70%168.60%
  R2 (moderate or quite a bit)10537.90%5019.40%4819.40%3317.80%P < 0.00001*0/1, 0/2, 0/3
  Observed cases277100.00%257100.00%248100.00%185100.00%
PFDI 46 (abdominal or lower back pain when straining for any reason)
  Symptom-free16760.30%21081.70%20582.70%15684.30%P < 0.00001*0/1, 0/2, 0/3
  Somewhat4215.20%166.20%135.20%105.40%
  Moderate3613.00%155.80%187.30%105.40%
  Quite a bit3211.60%166.20%124.80%94.90%
  R2 (moderate or quite a bit)6824.60%3112.00%3012.10%1910.30%P < 0.00001*0/1, 0/2, 0/3
  Observed cases277100.00%257100.00%248100.00%185100.00%


Table 4. Pre- and Postoperative Observed Cases and Occurrences of RPCs in the Anterior, Visceral, Posterior and All Complaint Areas in the Total Population (n = 277)
 
Location of pain symptomsBaseline (phase 0)6 m after surgery (phase 1)12 m after surgery (phase 2)24 m after surgery (phase 3)Cochran’s Q-tests for testing global effects (Q-values and corresponding P-values)McNemar tests for testing simple effects (phase pairs with signigicant differences)
Absolute frequencyRelative frequencyAbsolute frequencyRelative frequencyAbsolute frequencyRelative frequencyAbsolute frequencyRelative frequency
Additionally, the cure rates, ORs and 95% CIs of the ORs, when comparing the postoperative prevalence rates of RPCs with those at baseline, were entered. OR is the chance of symptom occurrence in an experimental condition (say A) divided by the chance of symptom occurrence in another experimental condition (say B). An OR equal to 1 means identical chances for symptom occurrence in both experimental conditions. Cochran’s Q-tests followed by McNemar tests were applied for testing global and simple effects of the surgery on the occurrence of RPCs in each complaint area. The same tests were also performed to test global and local complaint-area differences in the occurrence of RPC at baseline as well as at each postoperative phase (6, 12 and 24 months after surgery). “*” (“+”) indicates significant global surgery or region effects at a Bonferroni corrected level of significance (at the nominal level of significance α = 0.05). Number (capital letter) pairs characterize significant differences between corresponding phase or complaint-area pairs. Note that the analysis of single effects with the McNemar tests was only performed when the prior applied Cochran’s tests supply significant global effects. RPC: relevant pain complaint; OR: odds ratio; CI: confidence interval; PFDI: pelvic floor disorder inventory.
Front area (PFDI 1 and PFDI 2)
  Observed cases277257248185Q(DF = 3) = 136.56
  RPCs10537.90%3011.70%239.30%115.90%P < 0.00001*0/1, 0/2, 0/3
  Cure rates of the RPC69.13%75.46%84.43%
  OR of the RPC0.2160.1670.104
  95% CI of OR0.14 - 0.340.10 - 0.270.05 - 0.20
Visceral area (PFDI 3 and PFDI 6)
  Observed cases277257248185Q(DF = 3) = 193.41
  RPCs12946.60%228.60%187.30%115.90%P < 0.00001*0/1, 0/2, 0/3
  Cure rates of the RPC81.55%84.33%87.34%
  OR of the RPC0.1070.0900.073
  95% CI of OR0.07 - 0.170.05 - 0.150.04 - 0.13
Posterior area (PFDI 7 and PFDI 46)
  Observed cases277257248185Q(DF = 3) = 37.44
  RPCs12244.00%6224.10%5622.60%3924.10%P < 0.00001*0/1, 0/2, 0/3
  Cure rates of the RPC45.23%48.64%45.23%
  OR of the RPC0.4030.3700.339
  95% CI of OR0.28 - 0.570.26 - 0.530.23 - 0.51
Testing global and simple differences in the occurence of relevant complaints between areas (Cochran's Q- and McNemar tests)Q(DF = 2) = 6.92
P = 0.0314+
F/V
Q(DF = 2) = 37.33
P < 0.00001*
F/B, V/B
Q(DF = 2) = 44.10
P < 0.00001*
F/B, V/B
Q(DF = 2) = 36.46
P < 0.00001*
F/B, V/B
All areas (PFDI 1, 2, 3, 6, 7 and 46)
  Observed cases277257248185Q(DF = 3) = 122.20
  RPCs18767.50%8031.10%6727.00%4624.90%P < 0.00001*0/1, 0/2, 0/3
  Cure rates of the RPC53.93%59.98%63.11%
  OR of the RPC0.2180.1780.159
  95% CI of OR0.16 - 0.300.13 - 0.250.11 - 0.23


Table 5. Absolute and Relative Frequencies (Prevalence Rates) of RPCs for Patients With Posterior/Apical POP (Group paP; n = 135) and Those With Anterior/Apical POP (Group aaP; n = 142)
 
Regional dependent pain (posterior/apical (n = 135) versus anterior/apical (n = 142))Comparisons of postoperative RPCs in the front, visceral, back and all areas between patients with posterior/apical and anterior/apical POP-Q defect
Baseline (phase 0)6 m after surgery (phase 1)12 m after surgery (phase 2)24 m after surgery (phase 3)Cochran’s Q-tests for testing global effectsMcNemar tests for testing simple effects
Absolute frequencyRelative frequencyAbsolute frequencyRelative frequencyAbsolute frequencyRelative frequencyAbsolute frequencyRelative frequency
“*” (“+”) indicates significant global surgery or group effects on the prevalence of RPC at a Bonferroni corrected level of significance (at the nominal level of significance α = 0.05). Number pairs characterize significant differences between the corresponding phases. The prevalence rates of RPCs were significantly reduced after surgery in both groups and that for each complaint area (anterior, visceral, posterior and all areas (Cochran’s Q-tests, followed by McNemar tests, P < α*, where α* a Bonferroni corrected α (α* < α = 0.05)). Comparisons of the RPC frequencies between “paP” and “aaP” patients into each phase (baseline and 6, 12, 24 months after surgery) and in each complaint area showed that “aaP” patients had significantly more pain reduction than “paP” patients 6 and 24 months after surgery and that in any complaint area (X2-tests, P-values significant at the nominal α (= 0.05) or at a Bonferroni corrected level of significance α*, where α* < α). RPC: relevant pain complaint; POP-Q: pelvic organ prolapse quantification system; PFDI: pelvic floor disorder inventory.
Front area (PFDI 1 and PFDI 2) (RPC: “PFDI 1 = R2 or PFDI 2 = R2”)
  RPC in the posterior/apical sample5641.50%1511.80%1613.00%109.10%Q(DF = 3) = 67.370/1, 0/2, 0/3
  Total cases135127123110P < 0.00001*
  RPC in the anterior/apical sample4934.50%1511.50%75.60%11.30%Q(DF = 3) = 72.730/1, 0/2, 0/3
  Total cases14213012575P < 0.00001*
  X2-tests for testing posterior/apical vs. anterior/apicalX2(1) = 1.43
P = 0.231
X2(1) = 0.004
P = 0.945
X2(1) = 4.04
P = 0.044+
X2(1) = 4.79
P = 0.028+
Visceral area (PFDI 3 and PFDI 6) (RPC: “PFDI 3 = R2 or PFDI 6 = R2”
  RPC in the posterior/apical sample6850.40%1411.00%1411.40%109.10%Q(DF = 3) = 136.560/1, 0/2, 0/3
  Total cases135127123110P < 0.00001*
  RPC in the anterior/apical sample6143.00%86.20%43.20%11.30%Q(DF = 3) = 93.230/1, 0/2, 0/3
  Total cases14213012575P < 0.00001*
  X2-tests for testing posterior/apical vs. anterior/apicalX2(1) = 1.52
P = 0.256
X2(1) = 1.94
P = 0.162
X2(1) = 6.16
P = 0.013+
X2(1) = 4.79
P = 0.028+
Posterior area (PFDI 7 and PFDI 46) (RPC: “PFDI 7 = R2 or PFDI 46 = R2”)
  RPC in the posterior/apical sample6749.60%3729.10%3931.70%2926.40%Q(DF = 3) = 19.210/1, 0/2, 0/3
  Total cases135127123110P = 0.0002*
  RPC in the anterior/apical sample5538.70%2519.20%1713.60%1013.30%Q(DF = 3) = 21.980/1, 0/2, 0/3
  Total cases14213012575P = 0.0001*
  X2-tests for testing posterior/apical vs. anterior/apicalX2(1) = 3.33
P = 0.067
X2(1) = 3.44
P = 0.063
X2(1) = 11.62
P < 0.0001*
X2(1) = 4.55
P = 0.032+
All areas (PFDI: 1, 2, 3, 6, 7 and 46) (RPC: “at least one of the PFDIs = R2”
  RPC in the posterior/apical sample10074.10%4535.40%4839.00%3531.80%Q(DF = 3) = 65.150/1, 0/2, 0/3
  Total cases135127123110P < 0.00001*
  RPC in the anterior/apical sample8761.30%3526.90%1915.20%1114.70%Q(DF = 3) = 61.420/1, 0/2, 0/3
  Total cases14213012575P < 0.00001*
  X2-tests for testing posterior/apical vs. anterior/apicalX2(1) = 5.52
P = 0.018+
X2(1) = 2.17
P = 0.140
X2(1) = 17.84
P < 0.0001*
X2(1) = 7.02
P = 0.008*


Table 6. Absolute and Relative RPC Frequencies (Prevalence Rates) of Patients With Stage 2 POP-Q (Group S2P; n = 122) and Stage 3 or 4 POP-Q Stage (Group S34P; n = 150)
 
Regional dependent pain (POP-Q stage 2 (n = 122) versus POP-Q stage 3 or 4 (n = 150))Comparisons of postoperative RPCs in the front, visceral, back and all areasbetween patients with POP-Q stage 2 and POP-Q stage 3 or 4
Baseline (phase 0)6 m after surgery (phase 1)12 m after surgery (phase 2)24 m after surgery (phase 3)Cochran’s Q-tests for testing global effectsMcNemar tests for testing simple effects
Absolute frequencyRelative frequencyAbsolute frequencyRelative frequencyAbsolute frequencyRelative frequencyAbsolute frequencyRelative frequency
“*” (“+”) indicates significant global surgery or group effects on the prevalence of RPC at a Bonferroni corrected level of significance (at the nominal level of significance α = 0.05). Number pairs characterize significant (or marginal significant differences whenever provided with the superscript “+”) differences between the corresponding phases. The prevalence rates of RPCs were significantly reduced after surgery in both groups and that for each complaint area (anterior, visceral, posterior and all complaints) (Cochran’s Q-tests, followed by McNemar tests, P < α*, where α* a Bonferroni corrected α (α* < α = 0.05)). Comparisons of the RPC frequencies between “S2P” and “S34P” patients into each phase (baseline and 6, 12, 24 months after surgery) and in each complaint area showed that “S34P” patients had significantly more pain reduction than “S2P” patients 6 and 24 months after surgery in the anterior, posterior and the whole area (X2-tests, P-values significant at the nominal α (= 0.05) or at a Bonferroni corrected level of significance α*, where α* < α). POP-Q: pelvic organ prolapse quantification system; RPC: relevant pain complaint; PFDI: pelvic floor disorder inventory.
Front area (PFDI 1 and PFDI 2) (RPC: “PFDI 1 = R2 or PFDI 2 = R2”)
  RPC in the “POP-Q stage 2” sample4839.30%1311.60%1614.30%99.90%Q(DF = 3) = 49.250/1, 0/2, 0/3
  Total cases12211211291P < 0.00001*
  RPC in the “POP-Q stage 3/4” sample5536.70%1712.10%64.60%22.20%Q(DF = 3) = 86.280/1, 0/2, 0/3
  Total cases15014013189P < 0.00001*
  X2-tests for testing POP-Q stage 2 vs. POP-Q stage 3 or 4X2(1) = 0.20
P = 0.650
X2(1) = 0.02
P = 0.896
X2(1) = 6.90
P = 0.008*
X2(1) = 4.58
P = 0.032+
Visceral area (PFDI 3 and PFDI 6) (RPC: “PFDI 3 = R2 or PFDI 6 = R2”)
  RPC in the “POP-Q stage 2” sample5343.40%1311.60%1210.70%88.80%Q(DF = 3) = 65.260/1, 0/2, 0/3
  Total cases12211211291P < 0.00001*
  RPC in the “POP-Q stage 3/4” sample7449.30%96.40%64.60%33.40%Q(DF = 3) = 124.700/1, 0/2, 0/3
  Total cases15014013189P < 0.00001*
  X2-tests for testing POP-Q stage 2 vs. POP-Q stage 3 or 4X2(1) = 0.93
P = 0.332
X2(1) = 2.09
P = 0.146
X2(1) = 3.31
P = 0.068
X2(1) = 2.30
P = 0.129
Posterior area (PFDI 7 and PFDI 46) (RPC: “PFDI 7 = R2 or PFDI 46 = R2”)
  RPC in the “POP-Q stage 2” sample5543.40%3228.60%3632.10%2729.70%Q(DF = 3) = 11.240/1, 0/2+, 0/3+
  Total cases12211211291P = 0.0105+
  RPC in the “POP-Q stage 3/4” sample7449.30%3021.40%2015.30%1213.50%Q(DF = 3) = 25.960/1, 0/2, 0/3
  Total cases15014013189P < 0.00001*
  X2-tests for testing POP-Q stage 2 vs. POP-Q stage 3 or 4X2(1) = 0.08
P = 0.772
X2(1) = 1.71
P = 0.190
X2(1) = 9.69
P = 0.002*
X2(1) = 6.94
P = 0.008*
All areas (PFDI: 1, 2, 3, 6, 7 and 46) (RPC: “at least one of the PFDIs = R2”)
  RPC in the “POP-Q stage 2” sample5545.10%3934.80%4439.30%3235.20%Q(DF = 3) = 39.640/1, 0/2, 0/3
  Total cases12211211291P < 0.00001*
  RPC in the “POP-Q stage 3/4” sample6543.30%4129.30%2216.80%1415.70%Q(DF = 3) = 81.380/1, 0/2, 0/3
  Total cases15014013189P < 0.00001*
  X2-tests for testing POP-Q stage 2 vs. POP-Q stage 3 or 4X2(1) = 1.41
P = 0.559
X2(1) = 0.87
P = 0.348
X2(1) = 15.43
P < 0.0001*
X2(1) = 8.93
P = 0.002*