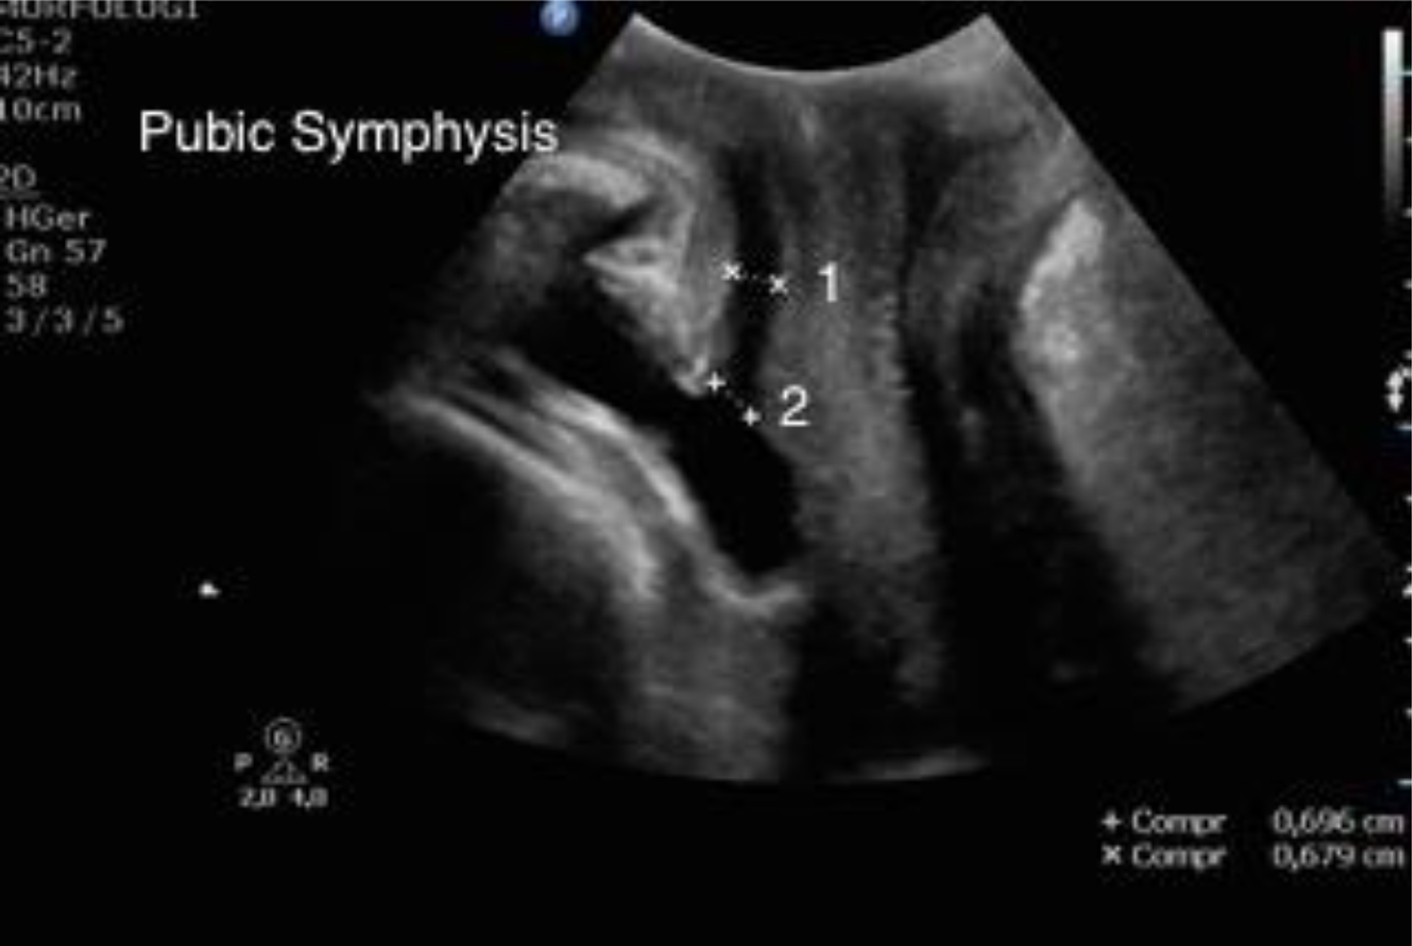
Figure 1. Pelvic floor ultrasound, midsagittal plane at rest. Arrow indicates the position of the symphysis pubis, i.e., point of reference for urethral measures. 1: urethral diameter at the mid urethra; 2: urethral diameter at the bladder neck.
| Journal of Clinical Gynecology and Obstetrics, ISSN 1927-1271 print, 1927-128X online, Open Access |
| Article copyright, the authors; Journal compilation copyright, J Clin Gynecol Obstet and Elmer Press Inc |
| Journal website https://www.jcgo.org |
Original Article
Volume 9, Number 4, December 2020, pages 102-107
Urethral Diameter at the Time of Birth and Its Implication on Urinary Incontinence
Figure
Tables
| Variables | Total (n = 151) | Vaginal birth (n = 73) | Cesarean section (n = 78) | P value* |
|---|---|---|---|---|
| *Student’s t- or Mann-Whitney test for independent samples. Significance set as P ≤ 0.05 for all analysis. BMI: body mass index; SEM: standard error of the mean; CI: confidence interval; P: statistical significance. | ||||
| Age, median (95% CI), years | 26.41 (24.51 - 26.57) | 22.36 (21.17 - 23.56) | 29.50 (27.14 - 29.88) | ≤ 0.0001 |
| Height, median (95% CI), m | 1.60 (1.60 - 1.62) | 1.61 (1.59 - 1.62) | 1.60 (1.59 - 1.62) | 0.343 |
| Initial gestational weight, median (95% CI), kg | 67.00 (65.80 - 70.76) | 62.00 (61.56 - 68.43) | 69.50 (67.85 - 74.85) | 0.008 |
| Final gestational weight, mean ± SEM, kg | 79.91 ± 1.26 | 77.38 ± 1.82 | 82.27 ± 1.71 | 0.052 |
| Final gestational BMI, mean ± SEM, kg/m2 | 30.95 ± 0.44 | 29.77 ± 0.59 | 32.05 ± 0.64 | 0.010 |
| Gestational weight gain, mean ± SEM, kg | 11.63 ± 0.48 | 12.39 ± 0.62 | 10.92 ± 0.71 | 0.122 |
| Previous pregnancies, median (95% CI) | 1.00 (1.43 - 1.70) | 1.00 (1.09 - 1.34) | 2.00 (1.67 - 2.10) | ≤ 0.0001 |
| Previous vaginal births, median (95% CI) | 0.00 (0.00 - 0.00) | 0.00 (0.00 - 0.00) | 0.00 (0.00 - 0.00) | 1.000 |
| Variables | Total (n = 151) | Vaginal birth (n = 73) | Cesarean section (n = 78) | P value* |
|---|---|---|---|---|
| *Chi-square test with adjusted residuals. Significance set as P ≤ 0.05 for all analysis. n: absolute frequency; n%: relative frequency; P: statistical significance. | ||||
| Urinary tract infection during pregnancy, n (n%) | 40 (26.5) | 21 (28.8) | 19 (24.4) | 0.668 |
| Diabetes mellitus, n (n%) | 9 (6.0) | 2 (2.7) | 7 (9.0) | 0.203 |
| Hypertension, n (n%) | 20 (13.2) | 4 (5.5) | 16 (20.5) | 0.013 |
| Variables | Total (n = 151) | Vaginal birth (n = 73) | Cesarean section (n = 78) | P value* |
|---|---|---|---|---|
| aVaginal birth (n = 5) and cesarean section (n = 4). bVaginal birth (n = 64) and cesarean section (n = 67). *Chi-square test with adjusted residuals, Student’s t- or Mann-Whitney test for independent samples. Significance set as P ≤ 0.05 for all analysis. UI: urinary incontinence; n: absolute frequency; n%: relative frequency; SEM: standard error of mean; P: statistical significance. | ||||
| UI during pregnancy, n (n%) | ||||
| Stress UI | 56 (37.1) | 30 (41.1) | 26 (33.3) | 0.324 |
| Urge UI | 37 (24.5) | 19 (26.0) | 18 (23.1) | 0.817 |
| Trimester of onset of UI symptoms, n (n%) | 0.650 | |||
| First | 8 (5.3) | 5 (6.8) | 3 (3.8) | |
| Second | 7 (4.6) | 3 (4.1) | 4 (5.1) | |
| Third | 55 (36.4) | 29 (39.7) | 26 (33.3) | |
| Birth weight, mean ± SEM, g | 3,164.4 ± 226.4 | 3,081.2 ± 51.0 | 3,034.6 ± 80.7 | 0.626 |
| Urethral diameter (level of the bladder neck)b, mean ± SEM, mm | 5.3 ± 0.6 | 5.6 ± 0.2 | 4.3 ± 0.2 | ≤ 0.0001 |
| Urethral diameter (level of the median urethra), mean ± SEM, mm | 5.6 ± 0.5 | 6.4 ± 0.2 | 6.6 ± 0.2 | 0.505 |
| UI 6 months after birth, n (n%)a | 9 (7.2) | 5 (7.7) | 4 (6.7) | 0.825 |
| Variables | Urethral diameter (level of the bladder neck) | Urethral diameter (level of the median urethra) | No UI during pregnancy | No UI 6 months after birth | ||||
|---|---|---|---|---|---|---|---|---|
| rs | P value* | rs | P value* | rs | P value* | rs | P value* | |
| *Spearman’s correlation test. Significance set as P ≤ 0.05 for all analysis. n: absolute frequency; n%: relative frequency; UI: urinary incontinence; BMI: body mass index; SEM: standard error of mean; rs: Spearman’s rho correlation coefficient; P: statistical significance. | ||||||||
| Urethral diameter (level of the bladder neck) | 1.000 | 1.000 | 0.279 | 0.001 | -0.073 | 0.409 | -0.077 | 0.425 |
| Urethral diameter (level of the median urethra) | 0.279 | 0.001 | 1.000 | 1.000 | 0.148 | 0.070 | 0.219 | 0.014 |
| No UI during pregnancy | -0.073 | 0.409 | 0.148 | 0.070 | 1.000 | 1.000 | 0.214 | 0.016 |
| No UI 6 months after birth | -0.077 | 0.425 | 0.219 | 0.014 | 0.214 | 0.016 | 1.000 | 1.000 |
| Age | -0.344 | ≤ 0.0001 | 0.054 | 0.507 | 0.005 | 0.947 | 0.042 | 0.641 |
| Height | -0.045 | 0.609 | -0.034 | 0.676 | -0.164 | 0.044 | 0.018 | 0.845 |
| Initial gestational weight | -0.207 | 0.017 | 0.070 | 0.391 | 0.001 | 0.993 | 0.004 | 0.966 |
| Final gestational weight | -0.190 | 0.029 | 0.055 | 0.502 | -0.058 | 0.481 | 0.002 | 0.985 |
| Final gestational BMI | -0.178 | 0.042 | 0.082 | 0.317 | 0.013 | 0.875 | -0.010 | 0.913 |
| Gestational weight gain | 0.001 | 0.989 | -0.016 | 0.849 | -0.111 | 0.177 | 0.011 | 0.902 |
| Previous pregnancies | -0.223 | 0.011 | 0.045 | 0.584 | -0.015 | 0.852 | -0.078 | 0.390 |
| No urinary tract infection during pregnancy | 0.166 | 0.058 | 0.021 | 0.796 | 0.080 | 0.331 | 0.129 | 0.150 |
| No diabetes mellitus | 0.025 | 0.773 | -0.165 | 0.042 | -0.066 | 0.422 | -0.078 | 0.390 |
| No systemic arterial hypertension | 0.269 | 0.002 | 0.028 | 0.730 | 0.029 | 0.728 | 0.160 | 0.074 |
| Trimester of onset of UI symptoms | -0.092 | 0.297 | 0.166 | 0.041 | 0.967 | ≤ 0.0001 | 0.273 | 0.002 |
| Birth weight | -0.064 | 0.465 | 0.139 | 0.088 | -0.097 | 0.235 | -0.024 | 0.787 |