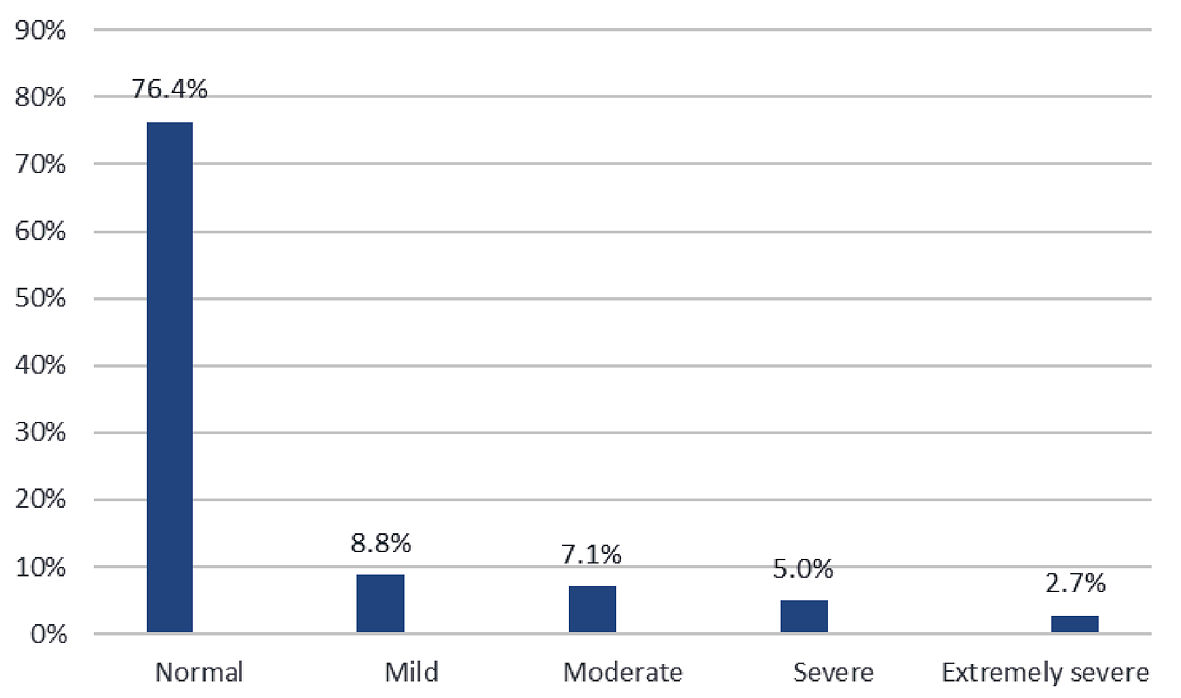
Figure 1. Distribution of stress symptom severity among the participants (n = 148).
| Journal of Clinical Gynecology and Obstetrics, ISSN 1927-1271 print, 1927-128X online, Open Access |
| Article copyright, the authors; Journal compilation copyright, J Clin Gynecol Obstet and Elmer Press Inc |
| Journal website https://www.jcgo.org |
Original Article
Volume 10, Number 3, September 2021, pages 73-80
The Psychological Effects of the Coronavirus Disease 2019 Pandemic on Pregnant and Postpartum Women
Figures
Tables
| Characteristic | N (%) |
|---|---|
| aIncluding only those women who were pregnant (n = 42). | |
| Age in years | |
| 20 - 30 | 57 (38.5) |
| 30 - 40 | 81 (54.7) |
| 40 - 50 | 6 (4.1) |
| Missing | 4 (2.7) |
| Place of residence | |
| Muscat Wilayat | 14 (9.5) |
| Mutrah Wilayat | 4 (2.7) |
| Seeb Wilayat | 102 (68.9) |
| Qurayat Wilayat | 1 (0.7) |
| Al Amerat Wilayat | 4 (2.7) |
| Bowsher Wilayat | 23 (15.5) |
| Education level | |
| Postgraduate (master’s degree/doctorate) | 29 (19.6) |
| Secondary | 25 (16.9) |
| University (diploma/bachelor’s degree) | 94 (63.5) |
| Employment status | |
| Employed | 102 (68.9) |
| Retired | 1 (0.7) |
| Student | 2 (1.4) |
| Unemployed | 43 (29.1) |
| Reproductive category | |
| Pregnant | 42 (28.4) |
| Immediate postpartum period (≤ 3 months) | 106 (71.6) |
| Trimester of pregnancya | |
| First | 7 (16.7) |
| Second | 8 (19.0) |
| Third | 27 (64.3) |
| Item | N (%) |
|---|---|
| COVID-19: coronavirus disease 2019. | |
| What is your COVID-19 status? | |
| I developed symptoms but did not do the test | 8 (5.4) |
| I was/am infected | 14 (9.5) |
| I was/am not infected | 126 (85.1) |
| Did the pandemic have an effect on your number of health visits? | |
| Yes | 71 (48.0) |
| No | 77 (52.0) |
| Did the pandemic have a negative effect on your pregnancy or delivery preparations? | |
| Yes | 116 (78.4) |
| No | 32 (21.6) |
| Did you miss the presence of friends and family during pregnancy or after birth? | |
| Yes | 116 (78.4) |
| No | 32 (21.6) |
| Participant characteristic | Stress | P valuea | Anxiety | P valuea | Depression | P valuea | |||
|---|---|---|---|---|---|---|---|---|---|
| No (105) | Yes (35) | No (104) | Yes (44) | No (102) | Yes (46) | ||||
| aChi-square test P value. *Statistically significant at P ≤ 0.05. COVID-19: coronavirus disease 2019. | |||||||||
| Age (years) | 0.616 | 0.522 | 0.906 | ||||||
| 20 - 30 | 40 (38.1) | 15 (42.9) | 34 (32.7) | 16 (36.4) | 32 (31.4) | 14 (30.4) | |||
| 30 - 40 | 57 (54.3) | 12 (34.3) | 61 (58.7) | 20 (45.4) | 55 (53.9) | 19 (41.3) | |||
| 40 - 50 | 7 (6.7) | 6 (17.1) | 8 (7.7) | 5 (11.4) | 15 (14.7) | 13 (28.3) | |||
| Missing | 1 (0.9) | 2 (5.7) | 1 (0.9) | 3 (6.8) | |||||
| Education level | 0.340 | 0.340 | 0.562 | ||||||
| Postgraduate (master’s degree/doctorate) | 19 (18.1) | 7 (20.0) | 22 (21.2) | 7 (15.9) | 19 (18.6) | 10 (21.7) | |||
| Secondary | 17 (16.2) | 7 (20.0) | 14 (13.5) | 11 (25%) | 14 (13.7) | 11 (23.9) | |||
| University (diploma/bachelor’s degree) | 69 (65.7) | 21 (60.0) | 68 (65.4) | 26 (59.1) | 69 (67.6) | 25 (54.3) | |||
| Employment status | 0.876 | 0.311 | 0.975 | ||||||
| Employed | 72 (68.6) | 23 (65.7) | 72 (69.2) | 30 (68.2) | 70 (68.6) | 32 (69.6) | |||
| Unemployed | 33 (31.4) | 11 (31.4) | 31 (29.8) | 14 (31.8) | 31 (30.4) | 14 (30.4) | |||
| Missing | 1 (2.9) | 1 (1.0) | 1 (1.0) | ||||||
| Monthly income (in Omani rials) | 0.559 | 0.006* | 0.011* | ||||||
| < 500 | 11 (10.5) | 5 (14.3) | 7 (6.7) | 22 (50.0) | 7 (6.9) | 23 (50.0) | |||
| 500 - 1,000 | 40 (38.1) | 10 (28.6) | 40 (38.5) | 11 (25.0) | 39 (38.2) | 12 (26.1) | |||
| > 1,000 | 54 (51.4) | 20 (57.1) | 57 (54.8) | 11 (25.0) | 56 (54.9) | 11 (23.9) | |||
| COVID-19 infection status | 0.439 | 0.360 | 0.871 | ||||||
| No | 98 (93.3) | 31 (88.6) | 95 (91.3) | 37 (84.1) | 93 (91.2) | 41 (89.1) | |||
| Yes | 7 (6.7) | 4 (11.4) | 9 (8.7) | 5 (11.4) | 9 (8.8) | 5 (10.9) | |||
| Missing | 2 (4.5) | ||||||||
| Presence of an elderly person (≥ 65 years) at home | 0.452 | 0.047* | 0.659 | ||||||
| No | 87 (82.9) | 27 (77.1) | 88 (84.6) | 16 (36.4) | 83 (81.4) | 36 (78.3) | |||
| Yes | 18 (17.1) | 8 (22.9) | 16 (15.4) | 28 (63.6) | 19 (18.6) | 10 (21.7) | |||
| Monthly income affected by pandemic | 0.21 | < 0.001* | < 0.001* | ||||||
| No | 88 (83.8) | 26 (74.3) | 93 (89.4) | 18 (40.9) | 90 (88.2) | 17 (37.0) | |||
| Yes | 17 (16.2) | 9 (25.7) | 11 (10.6) | 26 (59.1) | 12 (11.8) | 29 (63.0) | |||
| Missing the presence of family/friends during pregnancy/after birth | 28 (26.7) | 4 (11.4) | 0.063 | 28 (26.9) | 9 (20.5) | 0.016* | 27 (26.5) | 5 (10.9) | 0.033* |
| No | 77 (73.3) | 31 (88.6) | 76 (73.1) | 35 (79.5) | 75 (73.5) | 41 (89.1) | |||
| Yes | |||||||||
| Negative effect of the pandemic on pregnancy and birth preparations | 0.135 | 0.029* | 0.278 | ||||||
| No | 28 (26.7) | 5 (14.3) | 29 (27.9) | 5 (11.4) | 26 (25.5) | 8 (17.4) | |||
| Yes | 77 (73.3) | 30 (85.7) | 75 (72.1) | 39 (88.6) | 76 (74.5) | 38 (82.6) | |||