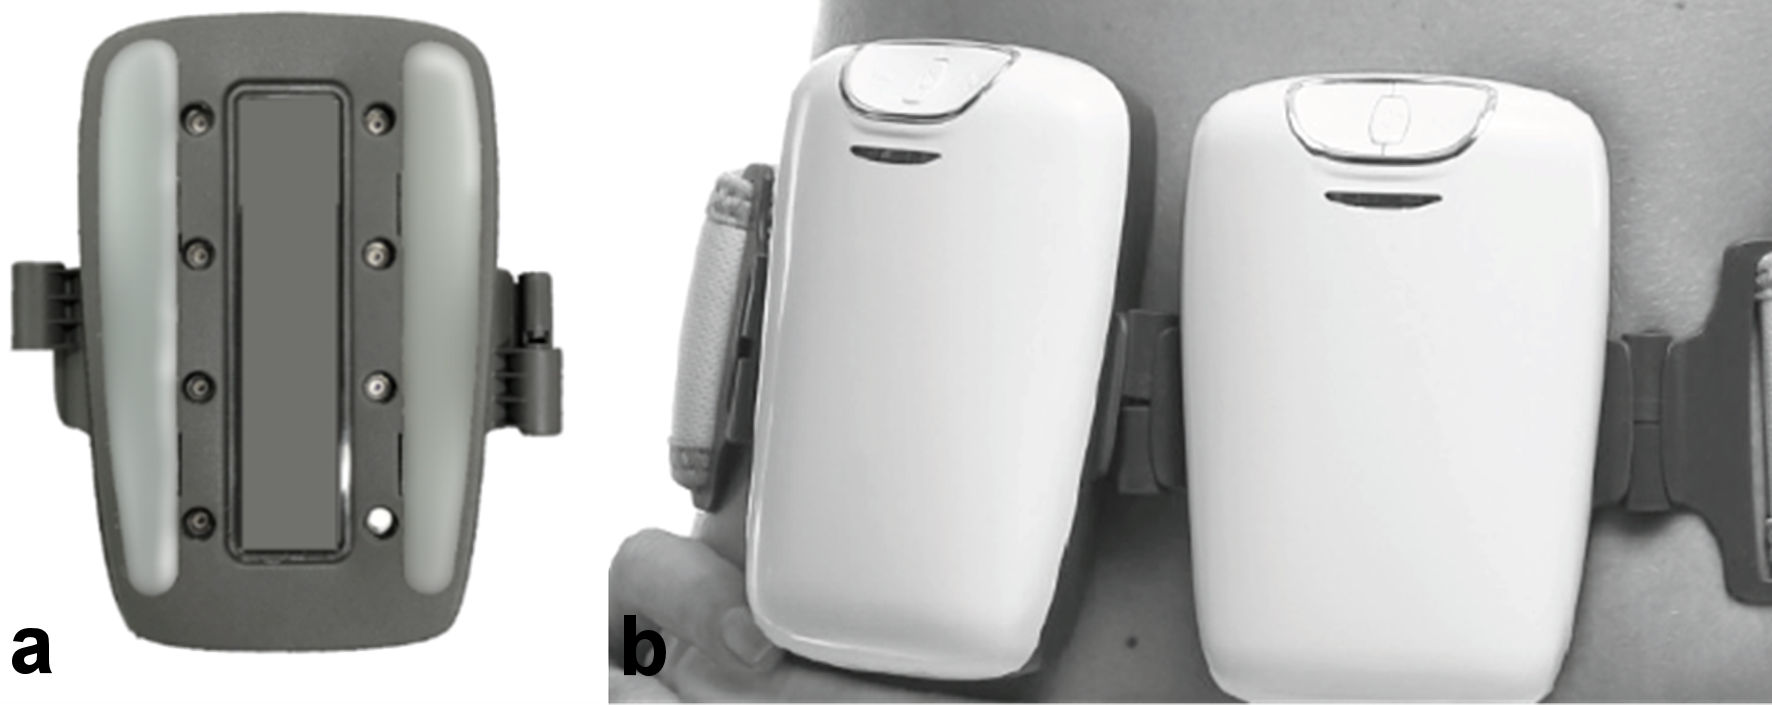
Figure 1. The Tone applicator. (a) Electrodes side of 1 unit. (b) Tone units on a belt attached to the abdomen.
| Journal of Clinical Gynecology and Obstetrics, ISSN 1927-1271 print, 1927-128X online, Open Access |
| Article copyright, the authors; Journal compilation copyright, J Clin Gynecol Obstet and Elmer Press Inc |
| Journal website https://www.jcgo.org |
Original Article
Volume 10, Number 3, September 2021, pages 59-66
A Randomized Controlled Trial to Evaluate the Effect of Abdominal Electrical Muscle Stimulation on Abdominal Wall Restoration in Postpartum Women
Figures
Tables
| Group A (EMS group, n = 28) | Group B (control group, n = 23) | |
|---|---|---|
| EMS: electrical muscle stimulation; BMI: body mass index. | ||
| Age | 29.65 | 29.22 |
| BMI | 27.62 | 27.76 |
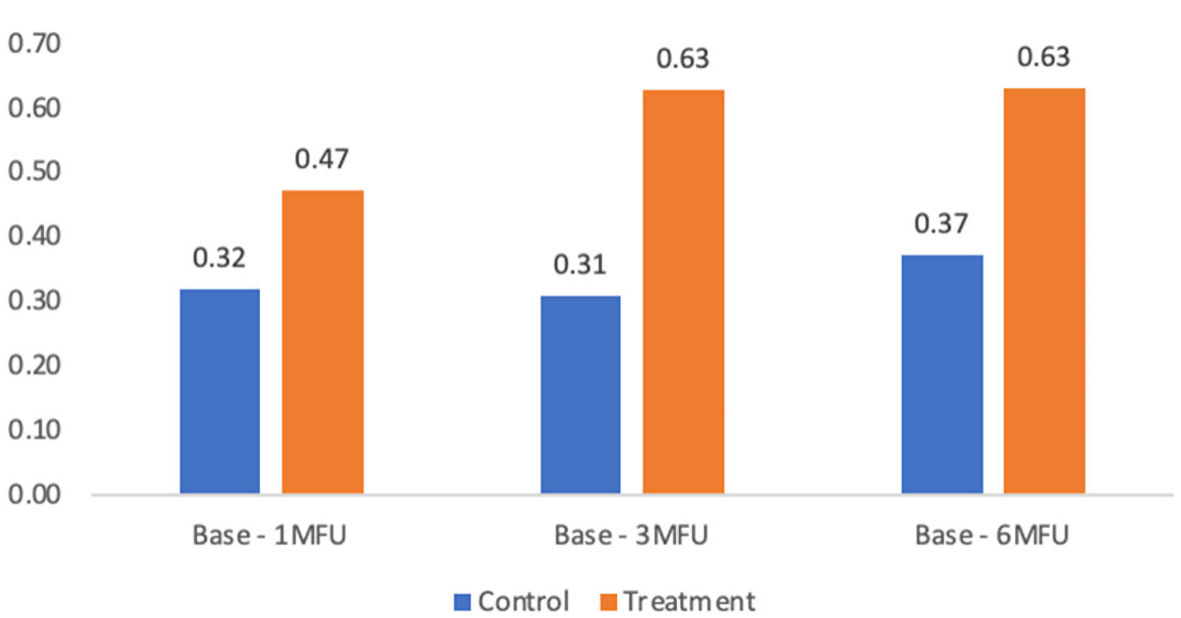
| Comparison | Control (mean ± SD) | Treatment (mean ± SD) | Difference | F | P |
|---|---|---|---|---|---|
| IRD: inter-rectal distance; SD: standard deviation. | |||||
| Base to 1-month follow-up | 0.32 ± 0.45 | 0.47 ± 0.60 | 0.15 | 1.03 | 0.31 |
| Base to 3-month follow-up | 0.31 ± 0.57 | 0.63 ± 0.67 | 0.32 | 3.74 | 0.06 |
| Base to 6-month follow-up | 0.37 ± 0.55 | 0.63 ± 0.71 | 0.26 | 1.90 | 0.18 |
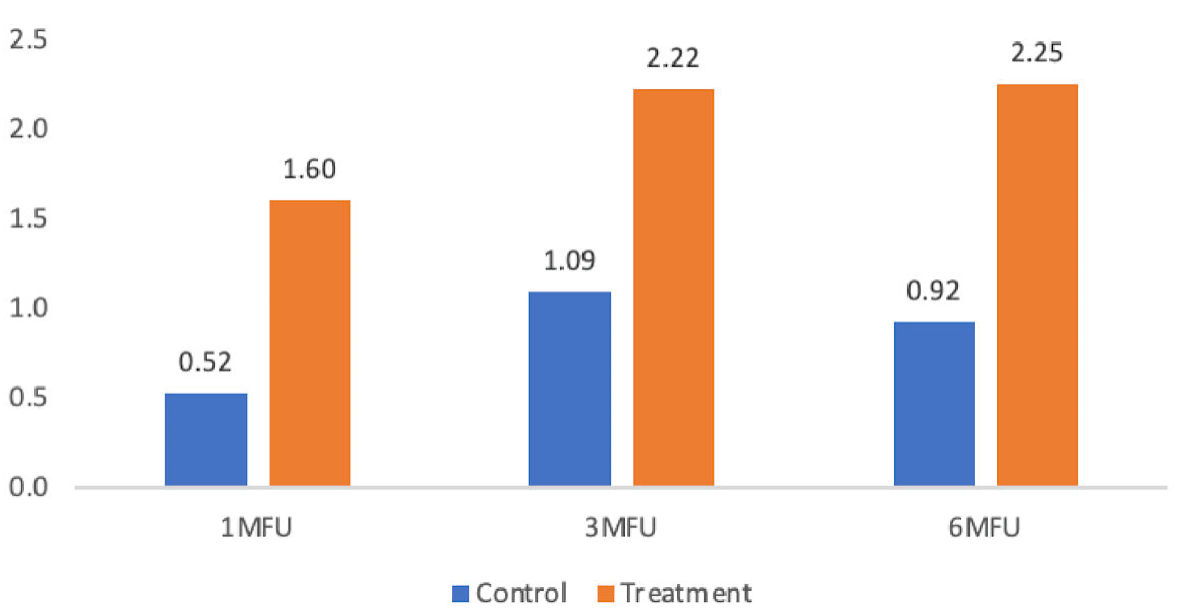
| Comparison | Control (mean ± SD) | Treatment (mean ± SD) | Difference | F | P |
|---|---|---|---|---|---|
| SD: standard deviation. | |||||
| Base to 1-month follow-up | 0.52 ± 0.67 | 1.60 ± 0.97 | 1.08 | 20.90 | < 0.001 |
| Base to 3-month follow-up | 1.09 ± 0.79 | 2.22 ± 1.05 | 1.14 | 18.01 | < 0.001 |
| Base to 6-month follow-up | 0.92 ± 1.04 | 2.25 ± 1.04 | 1.33 | 8.54 | 0.007 |
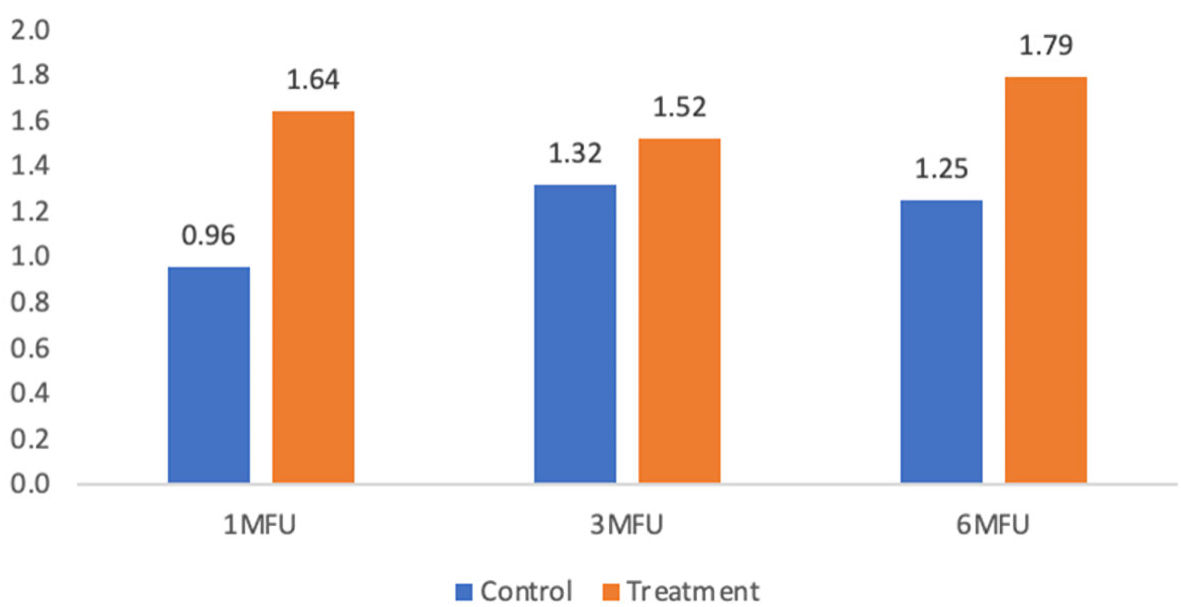
| Comparison | Control (mean ± SD) | Treatment (mean ± SD) | Difference | F | P |
|---|---|---|---|---|---|
| SD: standard deviation. | |||||
| Base to 1-month follow-up | 0.96 ± 1.22 | 1.64 ± 1.25 | 0.69 | 3.89 | 0.06 |
| Base to 3-month follow-up | 1.32 ± 1.46 | 1.52 ± 1.19 | 0.20 | 0.27 | 0.61 |
| Base to 6-month follow-up | 1.25 ± 1.55 | 1.79 ± 1.32 | 0.54 | 1.57 | 0.22 |
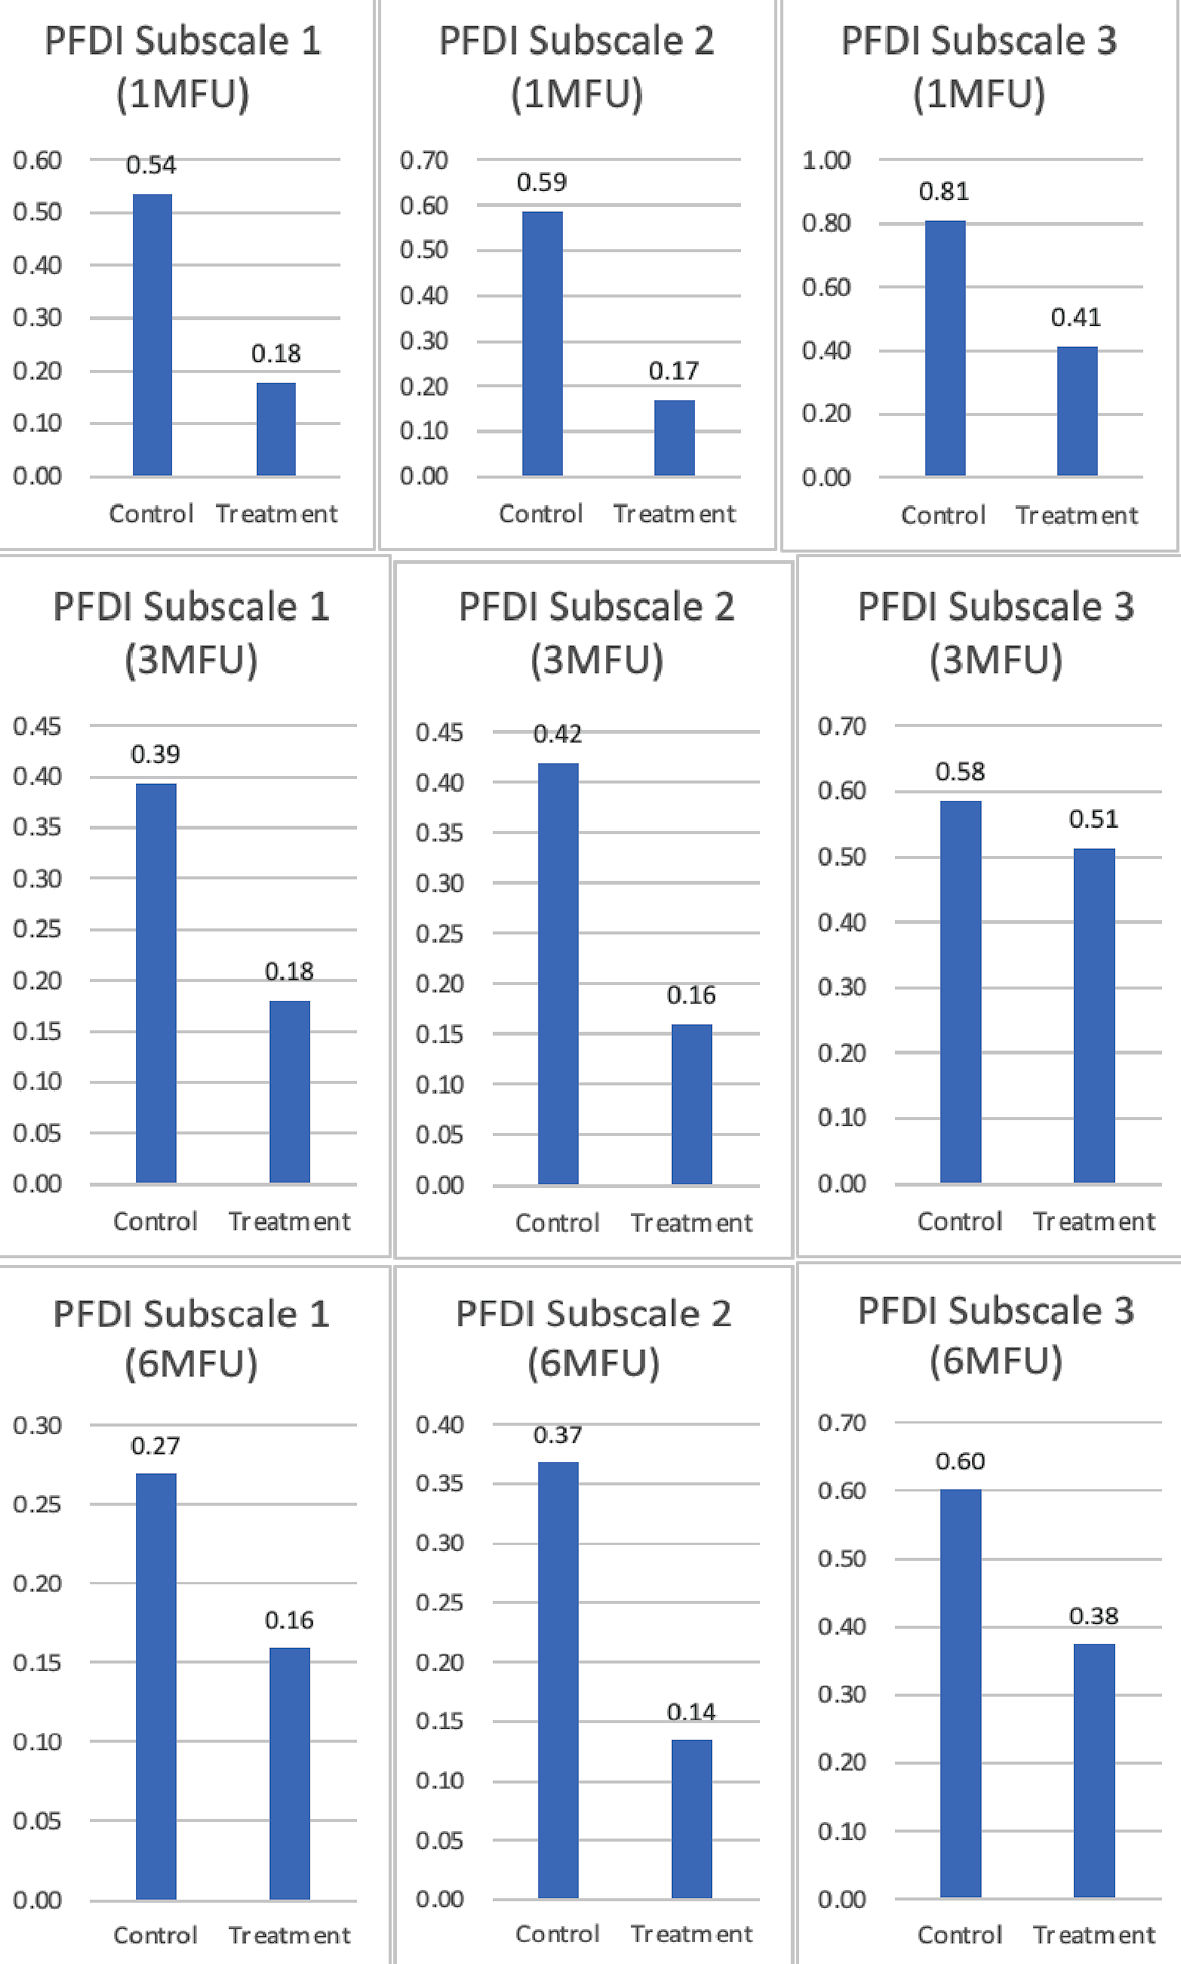
| Comparison | Control (mean ± SD) | Treatment (mean ± SD) | Difference | F | P |
|---|---|---|---|---|---|
| PFDI: Pelvic Floor Distress Inventory; SD: standard deviation. | |||||
| Subscale 1 (1-month) | 0.54 ± 0.74 | 0.18 ± 0.36 | 0.36 | 5.11 | 0.03 |
| Subscale 2 (1-month) | 0.59 ± 0.73 | 0.17 ± 0.26 | 0.42 | 7.90 | < 0.01 |
| Subscale 3 (1-month) | 0.81 ± 0.84 | 0.41 ± 0.63 | 0.40 | 3.71 | 0.06 |
| Subscale 1 (3-month) | 0.39 ± 0.57 | 0.18 ± 0.35 | 0.21 | 2.60 | 0.12 |
| Subscale 2 (3-month) | 0.42 ± 0.71 | 0.16 ± 0.27 | 0.26 | 2.84 | < 0.10 |
| Subscale 3 (3-month) | 0.59 ± 0.77 | 0.51 ± 0.62 | 0.07 | 0.14 | 0.73 |
| Subscale 1 (6-month) | 0.27 ± 0.47 | 0.16 ± 0.35 | 0.11 | 0.81 | 0.37 |
| Subscale 2 (6-month) | 0.37 ± 0.61 | 0.14 ± 0.27 | 0.23 | 2.93 | < 0.10 |
| Subscale 3 (6-month) | 0.60 ± 0.67 | 0.38 ± 0.52 | 0.23 | 1.67 | 0.20 |