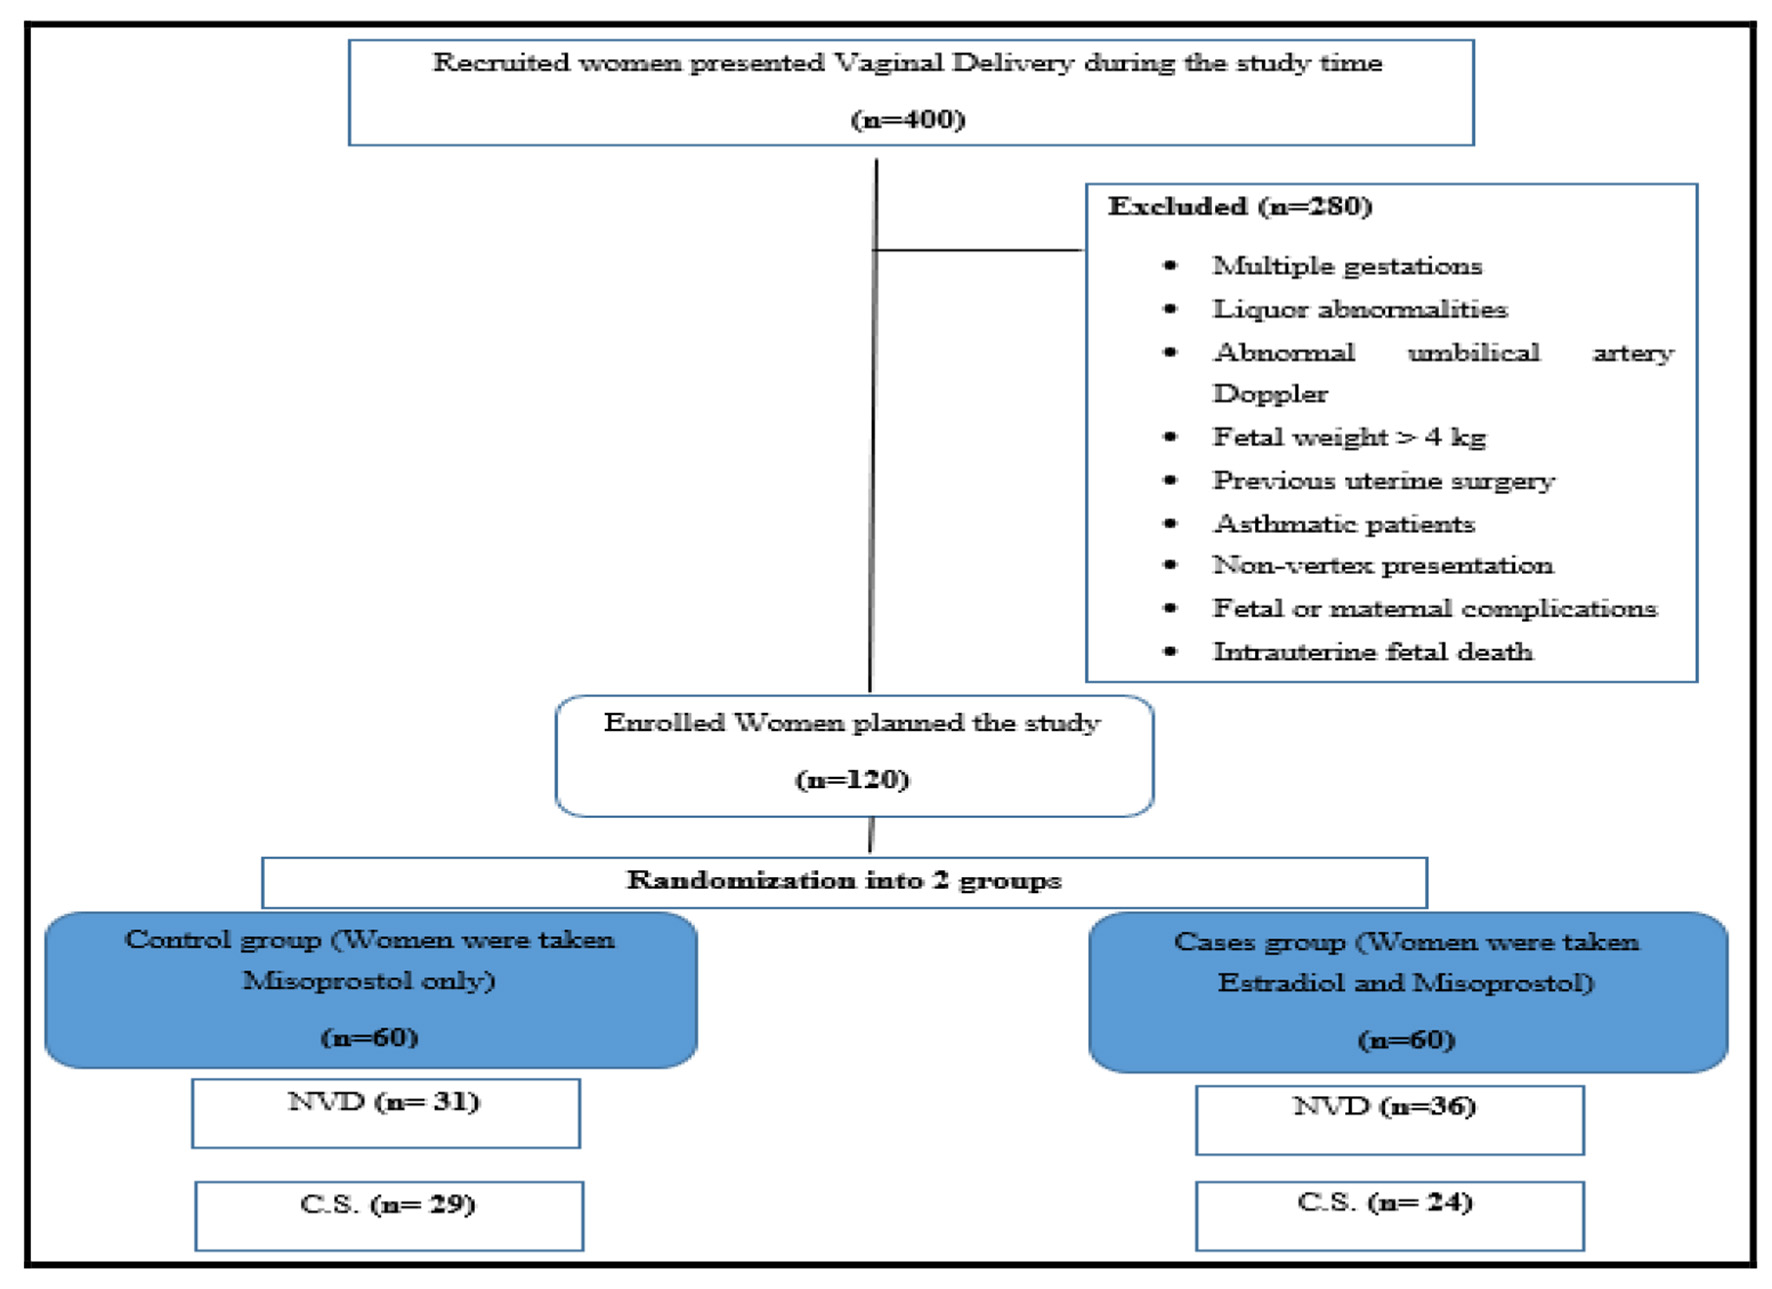
Figure 1. CONSORT flow diagram showing the recruitment and handling of the study population during the study. NVD: normal vaginal delivery; CS: cesarean section.
| Journal of Clinical Gynecology and Obstetrics, ISSN 1927-1271 print, 1927-128X online, Open Access |
| Article copyright, the authors; Journal compilation copyright, J Clin Gynecol Obstet and Elmer Press Inc |
| Journal website https://www.jcgo.org |
Original Article
Volume 11, Number 2, June 2022, pages 39-46
Comparative Study Between Using Only Vaginal Misoprostol and Using Vaginal Misoprostol and Estradiol Cream for Induction of Labor: A Randomized Controlled Trial
Figure
Tables
| Baseline characteristics | Misoprostol group (N = 60) | Estradiol group (N = 60) | Test of significance |
|---|---|---|---|
| aMann-Whitney test. bFisher’s test. cChi-square test. SD: standard deviation; IQR: interquartile range; ITP: idiopathic thrombocytopenic purpura; RA: rheumatoid arthritis; SLE: systemic lupus erythematosus; D&C: dilation and curettage. | |||
| Age | |||
| Range | 19 - 36 years | 19 - 45 years | |
| Mean ± SD | 26.2 ± 5.1 | 27.7 ± 6.9 | 0.179a |
| Median (IQR) | 25.5 (22.0 - 30.0) | 25.0 (22.8 - 32.0) | |
| Age category | |||
| 18 - 30 | 41 (68.3%) | 42 (70.0%) | |
| 30 - 40 | 19 (31.7%) | 14 (23.3%) | 0.092b |
| > 40 | 0 (0.0%) | 4 (6.7%) | |
| Parity | |||
| Primiparous | 22 (36.7%) | 29 (48.3%) | |
| Multipara | 38 (59.6%) | 31 (51.7%) | 0.268c |
| Gestational age | |||
| Range | 36 - 41+2 weeks | 36 - 42 weeks | |
| Mean ± SD | 38.9 ± 1.5 | 38.8 ± 1.6 | 0.91a |
| Median (IQR) | 38.9 (37.7 - 40.0) | 39.0 (37.3 - 40.0) | |
| Abortion times | |||
| Range | 0 - 3 times | 0 - 5 times | |
| Mean ± SD | 0.3 ± 0.7 | 0.4 ± 1.0 | 0.576a |
| Median (IQR) | 0.0 (0.0 - 0.0) | 0.0 (0.0 - 1.0) | |
| Medical history | |||
| Hypertension | 6 (10.0%) | 2 (3.3%) | 0.439 |
| Diabetes mellitus | 2 (3.3%) | 0 (0.0) | 0.496 |
| Other medical comorbidities | |||
| ITP | 2 (3.3%) | 0 (0.0) | 0.305 |
| RA | 1 (1.7%) | 0 (0.0) | |
| SLE | 1 (1.7%) | 0 (0.0) | |
| Thrombocytopenia | 1 (1.7%) | 1 (1.7%) | |
| Surgical history | |||
| Appendectomy | 2 (3.3%) | 3 (5.0%) | |
| Cholecystectomy | 0 (0.0) | 1 (1.7%) | 0.509b |
| Cystectomy | 0 (0.0) | 1 (1.7%) | |
| D&C | 0 (0.0) | 2 (3.3%) | |
| Tonsillectomy | 4 (6.7%) | 5 (8.4%) | |
| No | 54 (90.0%) | 48 (80.0%) | |
| Misoprostol group (N = 60) | Estradiol group (N = 60) | Test of significance | |
|---|---|---|---|
| aChi-square test. bMann-Whitney test. SD: standard deviation; IQR: interquartile range; NICU: neonatal intensive care unit. | |||
| Maternal complications | |||
| Postpartum hemorrhage | |||
| No | 60 (100.0%) | 60 (100%) | 1 |
| Uterus rupture | |||
| No | 60 (100.0%) | 60 (100.0%) | 1 |
| Hyperstimulation | |||
| Yes | 2 (3.3%) | 1 (1.7%) | 0.99 |
| Fetal outcome | |||
| Fetal hypoxia | |||
| No | 60 (100.0%) | 60 (100%) | 1 |
| Meconium staining | |||
| Yes | 13 (21.7%) | 6 (10.0%) | 0.134a |
| Neonatal infection | |||
| Yes | 1 (1.7%) | 0 (0.0%) | 0.99 |
| First minute Apgar score | 0.009b | ||
| Mean ± SD | 6.5 ± 1.0 | 6.9 ± 0.4 | |
| Median (IQR) | 7.0 (6.0 - 7.0) | 7.0 (7.0 - 7.0) | |
| Fifth minute Apgar score | 0.136b | ||
| Mean ± SD | 8.7 ± 0.5 | 8.8 ± 0.4 | |
| Median (IQR) | 9.0 (8.0 - 9.0) | 9.0 (9.0 - 9.0) | |
| NICU admission | |||
| Yes | 10 (16.7%) | 6 (10.0%) | 0.421a |
| Misoprostol group (N = 60) | Estradiol group (N = 60) | Test of significance | |
|---|---|---|---|
| aChi-square test. NVD: normal vaginal delivery; CS: cesarean section. | |||
| Mode of delivery | |||
| NVD | 31 (51.7%) | 36 (60.0%) | |
| CS | 29 (48.3%) | 24 (40.0%) | 0.359a |
| Cause of CS induction | |||
| Failed induction | 14 (23.3%) | 12 (20.0%) | 0.825 |
| Uterine hyperstimulation | 2 (3.3%) | 1 (1.7%) | 1 |
| Tachysystole | 1 (1.7%) | 1 (1.7%) | 1 |
| Fetal distress | 12 (20.0%) | 9 (15.0%) | 0.631 |
| Misoprostol group (N = 60) | Estradiol group (N = 60) | Test of significance | |
|---|---|---|---|
| aChi-square test. bMann-Whitney test. IQR: interquartile range. | |||
| Active phase | |||
| No | 28 (46.7%) | 22 (36.7%) | |
| Yes | 32 (53.3%) | 38 (63.3%) | 0.355a |
| Time needed to enter active phase (h) | |||
| Range | 5.0 - 21.0 | 6.5 - 20.5 | |
| Median (IQR) | 13.5 (11.0 - 17.0) | 14.5 (11.2 - 17.9) | 0.701b |
| Induction delivery time (h) | |||
| Range | 6.5 - 23.0 | 8.5 - 22.0 | |
| Median (IQR) | 15.0 (12.5 - 18.6) | 16.8 (13.1 - 19.8) | 0.519b |